Multi State Operator
New Customer Analysis
Proving the Lift: How One Cannabis MSO Achieved 3x Immediate and 9x Lifetime ROAS
Campaign Objective:
Acquire new customers efficiently
Win back dormant customers across stores
Increase order frequency and engagement from active customers
Deliver measurable incremental revenue with strong ROI
Strategy:
Live and recorded training on campaign setup, targeting, and optimizations
Slack/Helpdesk access for questions and troubleshooting
Campaign planning templates (audience, creative, brief)
CPM incentive guide and setup checklist
At a Glance
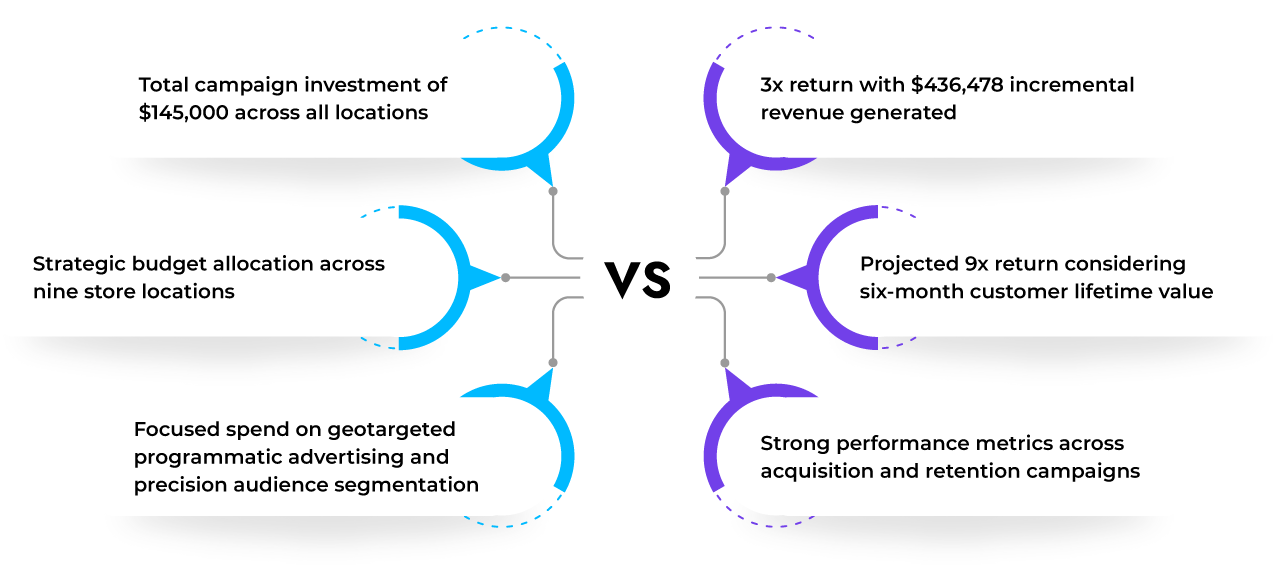
Total Ad Spend: $145,000
Timeline: 6 months
Locations: 9
New Customer Revenue: $122,876
Winback Revenue: $313,602
Total Revenue: $436,478
Projected 6-Month Revenue: $1.3M+
True 6-Month ROI: ~9.0x
300%+
Generated $436,478 incremental revenue,
with projected 6-month returns approaching 9x ROI
1,651
New Customers
Customer Acquisition
Acquired 1,651 new customers at $87.89 cost per acquisition
New customer revenue of $122,876 generated
$584K projected in 6-monthnew customer value, a 4x return.
New Customer AOV = $74.55
3,686
Winback Customers
Customer Reactivation
Reactivated 3,686 dormant customers, generating significant winback revenue and renewed engagement patterns
Generated $313,602 in winback revenue streams
Cost per reactivation = $39.33 per customer
Winback AOV= $85.13
117.8%
True Incrementality
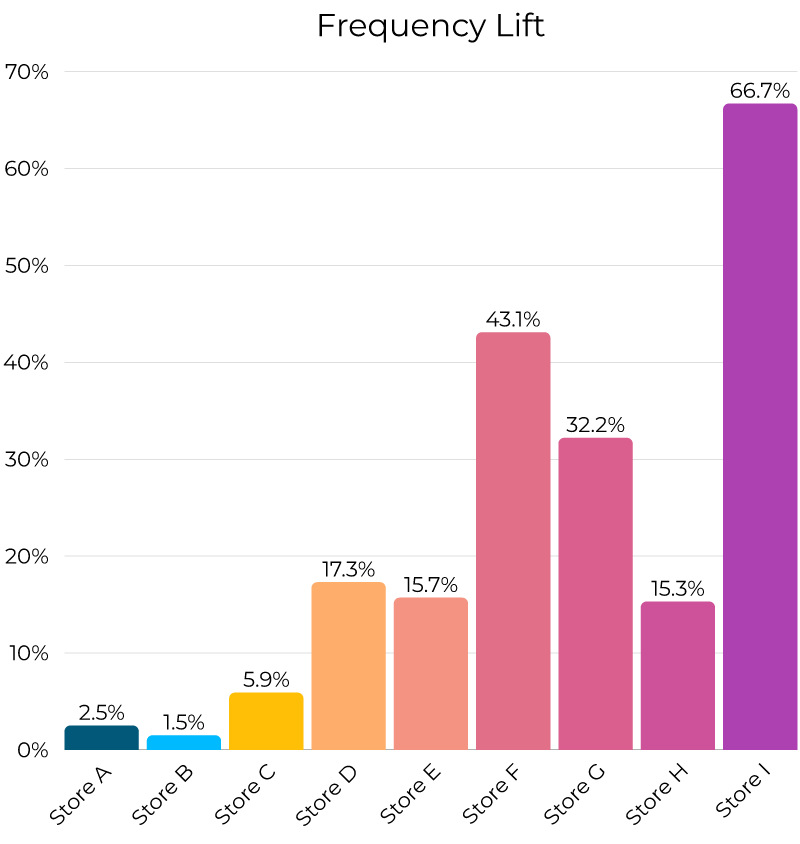
Frequency Optimization
Exposed customers bought 19.5% more often; 38.6% accelerated purchases.
Customers ordered 117.8% more frequently than control groups
Significant momentum with 38.6% of customer accelerating their purchase behavior
Frequency lift contributed to overall campaign success
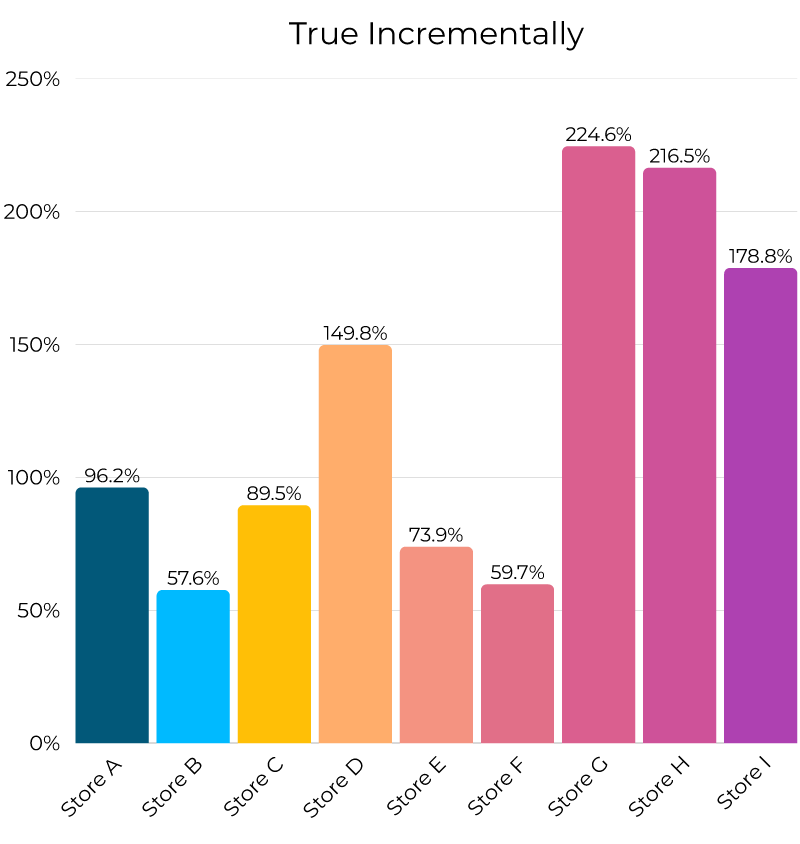
Store-By-Store Performance Analysis
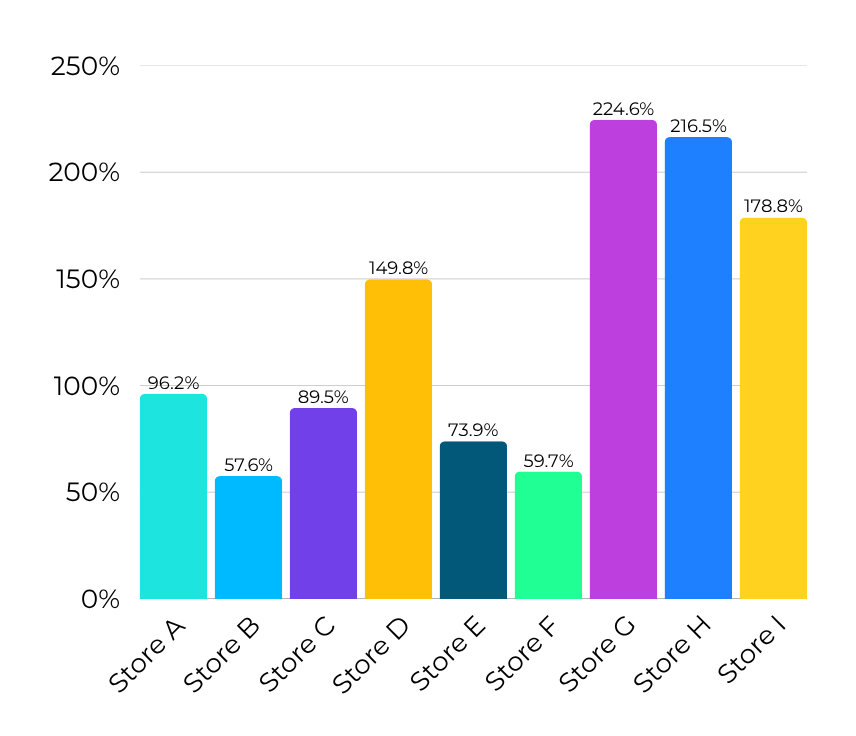
True Incrementally
This calculation removes natural market growth by comparing against a control group.
For example, if non-exposed customers increased orders by 10% due to summer seasonality, but exposed customers increased by 127.8%, the true incremental lift from our campaigns is 117.8%.
This represents the actual value created by our marketing efforts beyond what would have happened naturally.
Investment vs Results Analysis