Multi-state operators with underperforming locations often don't have a visibility problem — they have a diagnosis problem. This webinar gives MSO operators a structured framework for identifying which locations are underperforming and exactly what's driving the gap, using key metrics like gross margin, sales per square foot, and average customer spend.The session walks through how to diagnose performance issues at the location level, interpret the right data signals, and apply targeted strategies to bring underperforming stores back on track. MSO operators, regional managers, and anyone overseeing multi-location cannabis retail will find this a practical and measurement-grounded guide to improving performance across their portfolio.
100+ Cannabis Marketing Conversations
The lessons, mistakes, and growth strategies behind the industry’s most recognizable brands.
Browse Episodes

How to Identify and Boost Underperforming MSO Locations

Watch Our FREE OnDemand Webinars
Just fill out this form and you are set to watch.

Key Insights
- Identifying truly underperforming MSO locations requires market-normalized performance benchmarks rather than absolute revenue comparisons, because a location generating lower absolute revenue than the portfolio average may be performing excellently relative to its specific market potential while a high-revenue location may be underperforming severely relative to a more favorable competitive position.
- Underperforming cannabis dispensary locations typically show one of three root cause profiles: market-side underperformance where the location faces stronger competition, lower market demand, or unfavorable demographics; operational underperformance where customer experience quality, staff capability, or inventory management is producing lower conversion rates and average order values than the market would support; or marketing underperformance where the location lacks sufficient brand visibility and customer acquisition investment relative to its competitive environment.
- The fastest-acting interventions for marketing underperformance at MSO locations are typically local digital advertising campaigns targeting the specific geographic area of the underperforming location, local SEO improvements to the location's Google Business Profile, and targeted retention campaigns to reactivate lapsed customers in the location's loyalty database.
- MSOs that build standardized performance dashboards comparing all locations on normalized metrics create the visibility needed for proactive performance management, allowing regional and marketing teams to identify emerging performance gaps before they reach the severity of full underperformance requiring major intervention.
- Location-level marketing investment at MSOs should be dynamic rather than uniform, with underperforming locations receiving proportionally higher marketing attention and budget until performance reaches the portfolio benchmark, rather than equal allocation across all locations regardless of their individual market situations.
Expert Answers
[{How do MSOs identify underperforming cannabis dispensary locations?}
MSOs identify underperforming cannabis dispensary locations by comparing each location's performance against both portfolio benchmarks and market-normalized expectations. Key metrics for performance comparison include revenue per square foot, customer acquisition rate relative to market population, average order value, visit frequency of loyalty customers, new customer growth rate, and customer retention rate. Market normalization adjusts these metrics for local population density, competitive intensity, and market maturity to produce a fair comparison that separates locations performing below their market potential from those performing well in genuinely difficult market conditions. Locations that consistently fall below market-normalized portfolio benchmarks on multiple metrics are candidates for deeper performance diagnosis.
{What marketing interventions help underperforming cannabis dispensaries most?}
The most effective marketing interventions for underperforming cannabis dispensaries depend on the root cause of underperformance. For locations suffering from insufficient brand visibility and customer awareness, local digital advertising campaigns using geotargeting around the location, Google Business Profile optimization, and local SEO content that improves search visibility produce the fastest measurable traffic improvement. For locations with adequate traffic but poor conversion, in-store experience improvements and staff training produce faster results than more advertising. For locations with a declining existing customer base, retention campaigns targeting lapsed loyalty members with personalized reactivation offers address the churn problem more directly than acquisition campaigns that add new customers while existing ones continue to leave.
{How do cannabis MSOs standardize performance metrics across locations?}
Cannabis MSOs standardize performance metrics across locations by establishing a shared analytics infrastructure that pulls data from all location POS systems, loyalty platforms, and digital marketing systems into a centralized dashboard with consistent metric definitions, normalization methodologies, and reporting cadence. Common normalization approaches include expressing revenue per capita for the catchment area rather than absolute revenue, expressing customer metrics as penetration rates of the addressable market, and benchmarking competitive positioning metrics like review rating and local search ranking that reflect the relative market strength of each location. Standardized performance reporting allows regional and marketing leadership to make accurate portfolio-level comparisons and prioritize resource allocation toward the highest-opportunity underperformance situations.
{What is the typical timeline to see improvement after intervening at an underperforming cannabis location?}
The timeline to see meaningful performance improvement after intervention at an underperforming cannabis dispensary location depends on the type and severity of underperformance and the nature of the intervention. Marketing interventions such as increased local advertising and Google Business Profile optimization typically show measurable traffic improvement within four to eight weeks as campaigns reach frequency and new search visibility takes effect. Operational improvements such as staff training and customer experience redesign show improvement in conversion rate and average order value over a similar four to eight week window as the new practices become consistent. Retention campaign reactivation of lapsed loyalty customers produces the fastest measurable impact, often within two to four weeks of campaign launch, because it reaches a known audience with demonstrated purchase intent.]
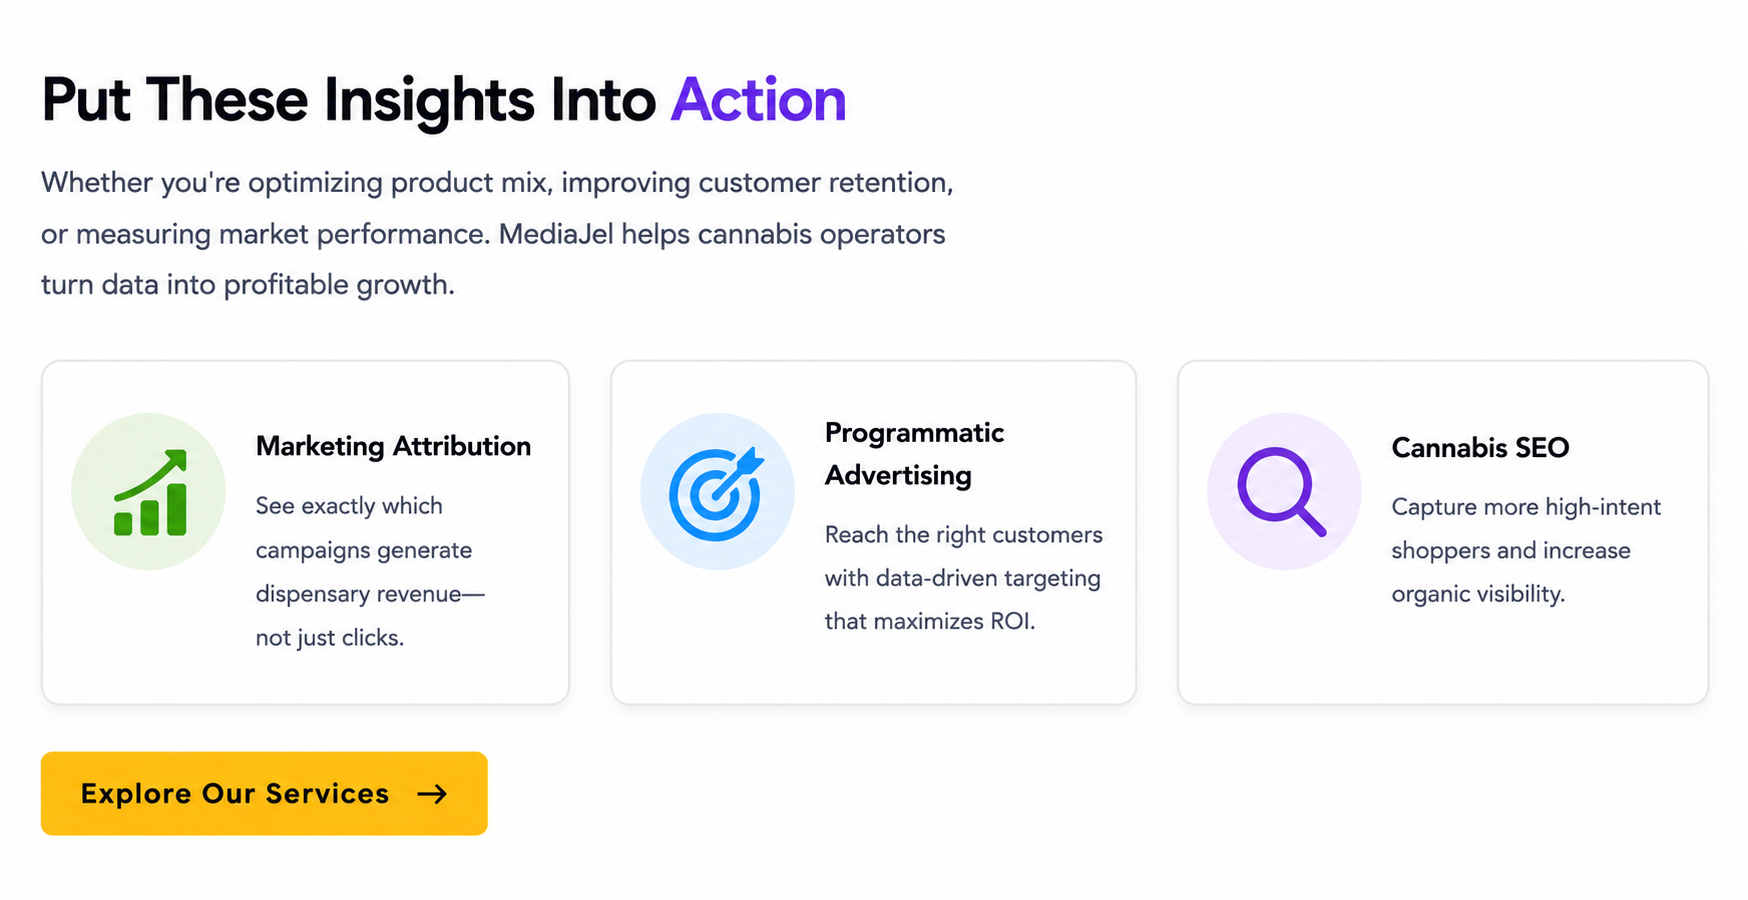
Put these Insights into Action
Whether you're optimizing product mix, improving customer retention, or measuring market performance. Mediajel helps cannabis operators turn data into profitable growth.
Marketing Attribution
See exactly which campaigns generate dispensary revenue - not just clicks.
Programmatic Advertising
Reach the right customers with data-driven targeting that maximizes ROI.
Cannabis SEO
Capture more high-intent shoppers and increase organic visibility.
Webinar Highlights
00:00 - The MSO Performance Management Challenge
The session opens by establishing why performance management across a multi-location cannabis dispensary portfolio requires a different analytical approach than single-location management, including the normalization requirements and root cause diagnostic frameworks that distinguish genuinely underperforming locations from those facing genuine market headwinds.
08:00 - Building the Normalized Performance Dashboard for MSO Portfolio Analysis
This section covers the specific metrics, normalization methodologies, and dashboard architecture that give MSO leadership an accurate comparative view of all location performance, enabling proactive identification of underperformance before it reaches severity levels that require major intervention.
18:00 - Diagnosing the Root Cause of Cannabis Location Underperformance
The webinar covers the diagnostic framework for identifying whether a specific location's underperformance is driven by market-side factors, operational execution gaps, or marketing investment insufficiency, and how the diagnosis determines the appropriate intervention strategy for each underperforming location.
26:00 - Marketing Interventions That Drive the Fastest Location Performance Improvement
This section covers the specific marketing tactics that produce the fastest measurable performance improvement for underperforming cannabis dispensary locations, including local digital advertising campaigns, Google Business Profile optimization, loyalty reactivation campaigns, and review generation programs that improve local search visibility.
34:00 - Building Ongoing Location Performance Monitoring for MSOs
The session closes with the performance monitoring infrastructure and review cadence that allows MSOs to maintain continuous visibility into location performance across the portfolio, identifying emerging gaps early and allocating marketing investment dynamically to locations where incremental spend will produce the highest incremental return.
Frequently Asked Questions
[ {What is a normal revenue range for a cannabis dispensary?}
Cannabis dispensary revenue varies enormously by state, market maturity, competitive density, location characteristics, and operational execution, making a universal "normal" revenue range of limited usefulness for individual operators. In mature legal markets with high competitive density, individual dispensary annual revenue ranges from a few million dollars to tens of millions for high-performing flagship locations in prime markets. In newer legal markets with limited license availability, individual dispensary revenues can exceed those in mature markets due to reduced competition. MSOs evaluating their specific location performance should benchmark against the market-specific competitive landscape rather than national averages, as market context is the most important determinant of what revenue level is achievable for a specific location.
{How do cannabis MSOs allocate marketing budget across locations?}
Cannabis MSOs allocate marketing budget across locations most effectively through a dynamic allocation framework that weights budget toward locations where incremental marketing investment will produce the highest marginal revenue return. This means directing above-average per-location budget to underperforming locations with identified marketing investment gaps and market potential that exceeds current revenue, maintaining baseline investment at performing locations to sustain competitive visibility, and directing below-average per-location budget to locations that are already capturing dominant market share where incremental marketing investment produces diminishing returns. The allocation should be reviewed quarterly and adjusted based on location performance trends rather than maintained as a fixed per-location formula throughout the year.
{What competitive analysis should cannabis MSOs do for underperforming locations?}
Cannabis MSOs should conduct location-specific competitive analysis for underperforming dispensaries that covers competitor count and proximity within the relevant drive-time zone, competitor review ratings and review volume as indicators of competitive brand strength, competitor pricing positioning and promotional activity as indicators of pricing pressure, competitor online ordering availability and delivery service as indicators of ecommerce competition, and competitor social media and local marketing activity as indicators of marketing investment intensity. This competitive profile helps distinguish underperformance caused by genuinely tough competitive conditions from underperformance caused by insufficient competitive response to a market environment that is beatable with the right marketing investment and operational improvement.
{How does cannabis loyalty data help MSOs manage location performance?}
Cannabis loyalty data helps MSOs manage location performance by providing customer-level behavioral visibility that aggregate revenue metrics cannot reveal. Loyalty data shows customer visit frequency trends at each location, whether frequent customers are visiting less often than historical baseline, whether new customer enrollment is growing or declining relative to market population, which customer segments are churning and at what rate, and how the location's loyal customer profile compares to high-performing locations in the portfolio. These behavioral signals often provide earlier warning of emerging performance problems than revenue metrics alone, because customer visit frequency and loyalty enrollment changes precede revenue impact by weeks, giving MSO teams time to intervene with retention and acquisition campaigns before the revenue gap becomes severe. ]
Cannabis Podcast Full Transcript
[ {How to identify and boost underperforming locations}
good morning and thank you for joining us we will get started very shortly here just give a couple more minutes for the other attendees to join us thank you once again for taking the time out of your day good morning thank you very much for taking the time out of your day to join us on this webinar we will be getting started here in just a few seconds uh just giving a couple more minutes here for the other attendees to join us wonderful thank you once again for taking the time out of your day to join us today we're going to be discussing how to identify and boost underperforming multi-store locations we're also going to be discussing how to strengthen your weakest link and get more sales out of individual locations if you're just joining us once again we are foot traffic um we are a digital marketing agency covering all legal states medicinal recreational and delivery in the united states along with canada we're going to be discussing how to increase overall value in all locations this is certainly one item that we find customers with multi-state operations and or stores in different regions of the same state can sometimes have different marketing strategies so in just a moment here um give it just another 30 seconds or so to kick start if you're just joining us thank you once again for taking the time out of your day we certainly appreciate it and let's get underway so in our agenda today we're going to be covering the metrics you need to check across all of your dispensaries how to use that data to create unique strategies per location and the highest roi tools that will boost your sales my name is eduardo silva i will be your host here today i have overall 18 years in marketing and sales experience so i'm hoping to share some of that experience with you and if you're uh joining us from outside of california if you wouldn't mind uh just getting familiar with the interface and i certainly always like to start by knowing where you're joining us from there is a chat window there if you want to just type in there where in the country and or if you are in canada which province you're joining us from that would be great and i always like to start with this trick question where in the world is this beach located let's see who can guess it first wonderful we have bc canada thank you so much for joining us perfect let's talk a little bit about foot traffic and a little bit of a background so foot traffic as i mentioned a little earlier we're a digital marketing agency we cover over 20 states including canada we provide digital marketing services i like to really introduce ourselves as a digital marketing agency that focuses solely on the revenue driving for the digital marketing as well as marketing analytics those are our core competencies if you will and so with that being said having such a broad uh understanding and experience with different markets for cannabis we bring a lot of experience to the table and we love to share that information with you today a couple housekeeping items here if you are not so familiar with zoom i imagine that most of us are by now please do take a moment to just familiarize yourself with the zoom interface there has been an update so even if you are familiar perhaps it is a good way to just navigate around go to the top of your screen find that q a button we do have panelists here that's going to be assisting and addressing questions throughout the webinar we're going to be moving fairly quickly as well so there's a lot of content to cover so i do ask that you mute your cell phones that way you can avoid distractions and absorption a lot of this material faster thank you once again for your time and let's jump right in first step in you know creating this multi state or multi location strategy is diagnosing problems so are you able to currently understand what your data is telling you per location are you comparing the right metrics to get the best picture of how your dispensaries are performing between your pos system crm sms platform google data studio it's easy to get overwhelmed by the amount of data that we can collect so if you're suffering from information overloads overload or confused about what to do with all those numbers we're going to dial into the key productivity indicators that's kpis that you need to focus on to better identify underperforming locations and determine the best way to boost them an underperforming store threatens the viability of your brand if you want to succeed in the industry you need to identify them as soon as possible so your team can work on turning them around and to do this you do need the right information so let's talk about that first you need to know your market right before diving into the kpis you should be tracking we need to talk about the markets where your dispensaries are located before opening up a dispensary your team likely analyzed the viability of the location before securing a lease or building up out your store
{Diagnosing the problem}
that same information can be useful for defining the addressable market your addressable market is the potential customers within a certain distance of your dispensary if this information is more than five or ten years old it may be worthwhile to take another look since populations do change over time to determine your addressable market take a look at the age of the population within the 10 mile radius of your dispensary for suburban dispensaries this can be as much as 20 miles for medicinal dispensaries you will want to focus on eligible patients you also want to evaluate the competition how many dispensers are located near you what about the delivery services every competitor is fighting for a slice of that addressable market which means that the more competition there is the harder it will be to carve out your slice of the pie unless you expand your service you can't change your addressable market and unless you have a magic wand you can't make the competition disappear you can however improve your in-store experience and expand your marketing to get more customers and get more sales at an underperforming store if you need help understanding your customers we offer a customer profile services that details the demographics of your market we have two packages on this we have a one thousand dollar standard package and then we also have a five thousand dollar premium package now these packages show you everything behavior in terms of consumer purchasing behavior for cannabis age demographics also involving average household income anything that is really crucial for you to understand that addressable market and if you want to find out more information about these reports feel free to text profile to 411 669 and we'll put that information here in the chat window as well so you can have it as we go continue forward let's talk about in-store kpis that you need to track over time to be able to first identify an underperforming store and the issues he may be having you want to measure and track your foot traffic the number of transactions you do daily your average transaction total units per transaction your average unit price gross in that profit and the loyal the number of loyalty members associated with the location the number individuals who have opted in to your marketing messages and your online versus import in-person sales now that sounds like a lot of different metrics and we'll actually post those for you later as well so you can always refer back to it you will also want to measure your gross margin for every location your gross margin is your net sales minus your cost of goods sold once again gross margin your net sales minus your cost of goods solds this will help you determine how much your dispensary is making after covering your costs if your gross margin is too low you are not making enough profit to be sustainable and you either need to adjust your pricing or reduce your overall expenses your product sell through rate is a percentage that compares the units of sales to how much product you have on hand okay how quickly your moving products help you determine whether you're carrying what your customers want if you can break this down by brand and product type you can invest more in the types of products that get sold quickly so very important as well year-over-year sales provide insights into your dispensaries growth by comparing current sales with the previous year sales now comparing that percentage of growth across all of your locations can help you find stores that aren't growing as quickly so you can investigate their performance further another great metric here to track is sales per square foot which allows you to determine whether you're making the most out of your space by dividing your sales by the square footage
{Gross margin}
of your store you can see how much you're making per square foot this number allows you to compare across your locations so that you can better identify any differences between them that may be impacting your sales like product positioning and marketing factors as well for your set market when coming up with this number don't count your waiting area or security area only count the square footage of your selling space your average spend clues you in to how much people are spending at your dispensary in general if a store has a lower average spend you can look into how many average units per transaction they are selling or see which products are more popular to find out why it's lower it may be necessary to coach butt tenders to upsell cross-sell so that they have useful recommendations that increase your average spend per customer also consider how products are displayed are they tempting your customers to buy them are your bundling products are you bundling products that go together all of these kpis should be tracked and compared both within the store itself and across your other stores as well you can do this easily
{Sales per square foot}
in a spreadsheet if you have fewer locations large msos however may choose to create a report via their pos system or have proprietary software built that creates these reports automatically which is pretty standard in the retail sector once you have these numbers you will be better able to compare stores in different locations for online sales the kpis are very very similar to the ones we just discussed though you will be tracking how many people are going to your website i like to think of a website as your virtual store okay so where they are coming from is very important meaning where is your customers coming from
{Average spend}
how many are ordering the average transaction total the units per transaction and how many are loyal members choosing the correct online menu is crucial since most online menus in the cannabis industry do not offer revenue attribution okay again this info can be gathered and aggregated the same way as in-store kpis having in-store and online data side-by-side can help you better diagnose why your store is underperforming perhaps it's doing fine with online sales but not many people are stopping by maybe it's the other way around you will know you won't know this unless you're collecting these data points and looking at them regularly so what do we do with all of these kpis right what are they telling us remember you can collect all of the data you want but if you don't know how to read it or use it to your advantage it doesn't matter you will be wasting your time so because the size of the markets may vary across your locations tracking these metrics will allow you to compare across all of your locations regardless of where they're located if your location has been open for over a year and you're you've got no historical data or you do have historical data in this case you can look at your year-over-year increases to see if they are similar across the board if a location isn't growing as quickly or if it's performing worse than it did in previous year then you can take a further look at different metrics you're collecting right so you can see if you can spot any additional issues now that you know how to identify underperforming stores it's time to address the issue certain metrics will inform you that the problems of your dispensary may be facing are very much specific to a location okay for example if one of your stores has a lower percentage of loyal opt-ins boost that number by help by uh may help you increase your overall customer retention so for example if you do have right a tracking mechanism for your loyalty opt-ins
{Reading the metrics}
then and you spot that there is a lower percentage per a store you can boost that if you're not able to retain customers you will have to keep spending money to get new customers and building relationships with customers is vital for your business longevity and will result in more sales or if your reviews are suffering at one location which can have a direct impact on your sales then you can work with store managers to improve customer satisfaction and implement better reputation management strategies perhaps that location isn't training its blood tenders to your stores okay and the morale issue could be also a factor here right so making sure that you're paying attention to reviews going to be very important for your overall bottom line so your kpis won't diagnose the problem for you but they are symptom of a larger problem by honoring it
{Boost sales}
on those symptoms you have a better shot at correctly identifying the issues facing your location and finding ways to address them ultimately your dispensaries don't face the same challenges which means that what works at one may not work at another in order to maximize each location's visibility and connect with possible customers you must create individual marketing strategies that address the unique needs of your dispensary locations a one size fit fits all strategy will guarantee that you are having underperforming stores your audience is not the same for all of your dispensaries and you should not treat them all as if they are otherwise you are missing the opportunity to create relationships and build your brand locally based on the metrics and the data that you have about your market you can create a digital strategy to help boost your brand awareness and drop more traffic to your underperforming locations the following tools can be used to create a hyper local marketing campaign that will draw more people to your underperforming store and start boosting your overall business so let's jump in first and most importantly one of the most widely recognized ones is geo advertising which is sometimes called geo ads it is the use of display ads on a mobile device within a set geographical region you're definitely seeing these before while browsing on your phone plenty of companies outside of the cannabis industry use them to increase their reach including amazon wayfarer and several others why because geo ads allow you to connect with new customers in your target market online display ads
{Individual marketing strategies}
help you keep your dispensary front and center with your customers once they enter one of the perimeters you created for your ads they will see your ads if they use one of the mobile sites and apps within that network they can click back and go directly to your online menu there are different ways that you can use geo ads to your advantage you can focus on your service area you can target competitors you can even target areas where your customers are likely to be another great way to get people to your store is the use of text message marketing text messaging is the most widely used communication channel available today not everybody uses email or makes phone calls regularly anymore but about ninety percent of people text that means that your customers text and that you need to be using sms marketing as part of the digital marketing strategy to communicate with your customers where they are text messages uh in text message marketing should be a part of how you communicate with your customers and offer deals provide them opportunities to opt in at your pos and on your website and don't forget to make it exciting joining a vip program is more exciting than just getting a text message by creating a unique link that you sent to your sms subscribers you can also track who clicked the link and how many sales it led to not only is sms marketing inexpensive but it helps you increase sales and build relationships with customers the last tool many customers come to us and are sometimes surprised because mainly because it's been around for so long and it's generally taken for granted this is seo if you have multiple locations you need to ensure that your seo strategy focus on each location individually if you're not seeing enough traffic to your website or menu you should consider whether your seo strategy is working if you don't have an seo strategy that focuses on your local store you need to create one seo stands for search engine optimization which in the practice it's increasing the quality and the quantity of traffic to your website through organic search engine results organic traffic is one of the largest drivers of traffic to many of our clients websites and this is unpaid traffic that comes from google search engine optimization shows that your page is relevant to particular keywords in our business that may be san diego dispensary detroit provisioning center or santa rosa marijuana delivery optimizing your site around these keywords makes it more likely that people who are looking for some of these services that you are offering will find you when you have a good seo strategy two things will happen one you will show up higher in the search results and two you will get more organic traffic in fact the top three results of a search tends to get 75 of all of the traffic the lower you are in the search results the less traffic you will get more than half of our clients online sales come from organic traffic their seo strategy have more than shown their value and exceed their expectations time and time again one of our clients seo roi currently is at 93 dollars for every dollar spent on seo this is a no-brainer are you finding out about issues after the fact gathering information because sales are already suffering if you're tracking the wrong information or just not tracking at all you're going to be blindsided and you may not notice the problem until it's too late to implement a meaningful change you need to make sure that you have the right technology in place and it is working for you and set up to track the metrics that will give you the best picture of your dispensaries performance and you need to have individual marketing strategies in place to address the various challenges each of your locations face including offering markets and customers so we do have a strategy and a offering today that we're going to be launching for new customers only and this is 500 online orders for sixteen hundred and fifty dollars per month for three months okay so that's 500 online orders for sixteen hundred and fifty dollars per month for three months that means that we will use a combination of strategies here to advertise your business and get conversion done on your website okay so your online menu great opportunity uh to earn new customers and jump into digital marketing without having to break the bank so with that being said i'm going to turn it back over to questions any questions from the audience today feel free to use the q a panel on the top of the screen there on zoom and we'll go ahead and address
{Get tracking}
those questions live all right one great question here we're tracking online is there anything you need in particular great question so for tracking online there are a varying um amount of tools that can be used the first and the most important is the proper selection of an online menu do keep in mind that because our industry is still maturing there are a lot of online many technologies that do not offer the capability of tracking the proper source of the audience that is routed to your menu so this is crucial first step why is that without that proper tool you're not going to be able to sync it to a google analytics dashboard okay where we're going to be able to see exactly where your sources of revenue are your drop-off rate how many people are actually abandoning your cart right as they're going through the ordering cycle as well as your conversion rate you may have a store that has a really high conversion rate on their menu perhaps above 10 percent which is
{Questions?}
very much instrumental to running an e-commerce business but you won't know and you won't be able to make the necessary investments there so one selection of the online menu having a proper website that is one speedy for the for the client right as they're browsing through and doesn't offer any challenges for that consumer right you want to convert the consumer once they come to your online menu you want to make sure that their experience is very much fluid thank you for that question great question we create different campaigns for different mso locations absolutely the first and most important aspect of creating a campaign for a different mso locations multi-state operators right is identifying the target market understanding the behavior of that consumer what is the saturation right do you have a lot of competitors what is your total cost per acquisition uh in that location or what is your cost per click right if you're running a digital marketing so all of these are factors that we take into account when building a marketing strategy for you and quite frankly there is no um cookie cutter approach that can be done for multi-states this has to be done strategically but the great thing is that foot traffic we have so much experience working across every single state that we can launch a campaign for you in what would probably take you six months to nine months to really design a proper campaign and understand the behavior we can do that in in less than 30 days sometimes in just a week so definitely get in touch with us we're happy to to discuss that with you offline as well if you have a specific case you would like to run and we'll be happy to recommend wonderful so uh one last question here we'll turn it up to some closer remarks but what products would us what would foot traffic recommend for canadian dispensaries and i'm assuming here that the question is relating to different digital marketing products or different digital marketing strategies first and foremost um seo will certainly be a big uh influence in any online uh e-commerce play right so your digital marketing uh strategy should be encompass seo because as we discussed here today it is one of the biggest drivers it is a longer term investment however it is one of the biggest revenue drivers for every single one of our customers at embarking seo some of our customers are seeing up to 93 dollars return on every dollar spent it's unbelievable so seo certainly google ads we run google ads successfully and compliantly in canada in any state in the united states and this is a great way to drive new customers capture new market and then geo ads is also very important geo ads uh i think those three would be the biggest drivers i would say for new customer acquisition and then finally sms is really a loyalty driver right so if you don't have a a proper sms strategy which integrates directly to your marketing strategy you may be at a loss there because you're going to be continuously purchasing new customers when you can also further enhance your relationship with your existing customers great questions thank you so much for for asking those and uh with that being said um also for sticking around with us you have qualified for a free yeti tumbler for those of you in the united states we do not ship those internationally yet but if you have stuck around with us as you did please do get in touch with us here is the link for traffic dot me forward slash call let's schedule a quick call and let's uh let's get your your free yeti to you i want to thank you once again for taking the time out of your day we certainly appreciate it and we hope you have found this information very helpful and once again if you would like a individual strategy built around one of your locations if you have a use case we're happy to help have a wonderful rest of your day and please do stay safe out there have a great one ]
Read More
Featured Speakers
Related Cannabis Podcasts

The Anatomy of a High-Engagement Instagram Post

Creating a Marijuana Delivery Service Marketing Strategy
Key Insights
- Identifying truly underperforming MSO locations requires market-normalized performance benchmarks rather than absolute revenue comparisons, because a location generating lower absolute revenue than the portfolio average may be performing excellently relative to its specific market potential while a high-revenue location may be underperforming severely relative to a more favorable competitive position.
- Underperforming cannabis dispensary locations typically show one of three root cause profiles: market-side underperformance where the location faces stronger competition, lower market demand, or unfavorable demographics; operational underperformance where customer experience quality, staff capability, or inventory management is producing lower conversion rates and average order values than the market would support; or marketing underperformance where the location lacks sufficient brand visibility and customer acquisition investment relative to its competitive environment.
- The fastest-acting interventions for marketing underperformance at MSO locations are typically local digital advertising campaigns targeting the specific geographic area of the underperforming location, local SEO improvements to the location's Google Business Profile, and targeted retention campaigns to reactivate lapsed customers in the location's loyalty database.
- MSOs that build standardized performance dashboards comparing all locations on normalized metrics create the visibility needed for proactive performance management, allowing regional and marketing teams to identify emerging performance gaps before they reach the severity of full underperformance requiring major intervention.
- Location-level marketing investment at MSOs should be dynamic rather than uniform, with underperforming locations receiving proportionally higher marketing attention and budget until performance reaches the portfolio benchmark, rather than equal allocation across all locations regardless of their individual market situations.
Expert Answers
[{How do MSOs identify underperforming cannabis dispensary locations?}
MSOs identify underperforming cannabis dispensary locations by comparing each location's performance against both portfolio benchmarks and market-normalized expectations. Key metrics for performance comparison include revenue per square foot, customer acquisition rate relative to market population, average order value, visit frequency of loyalty customers, new customer growth rate, and customer retention rate. Market normalization adjusts these metrics for local population density, competitive intensity, and market maturity to produce a fair comparison that separates locations performing below their market potential from those performing well in genuinely difficult market conditions. Locations that consistently fall below market-normalized portfolio benchmarks on multiple metrics are candidates for deeper performance diagnosis.
{What marketing interventions help underperforming cannabis dispensaries most?}
The most effective marketing interventions for underperforming cannabis dispensaries depend on the root cause of underperformance. For locations suffering from insufficient brand visibility and customer awareness, local digital advertising campaigns using geotargeting around the location, Google Business Profile optimization, and local SEO content that improves search visibility produce the fastest measurable traffic improvement. For locations with adequate traffic but poor conversion, in-store experience improvements and staff training produce faster results than more advertising. For locations with a declining existing customer base, retention campaigns targeting lapsed loyalty members with personalized reactivation offers address the churn problem more directly than acquisition campaigns that add new customers while existing ones continue to leave.
{How do cannabis MSOs standardize performance metrics across locations?}
Cannabis MSOs standardize performance metrics across locations by establishing a shared analytics infrastructure that pulls data from all location POS systems, loyalty platforms, and digital marketing systems into a centralized dashboard with consistent metric definitions, normalization methodologies, and reporting cadence. Common normalization approaches include expressing revenue per capita for the catchment area rather than absolute revenue, expressing customer metrics as penetration rates of the addressable market, and benchmarking competitive positioning metrics like review rating and local search ranking that reflect the relative market strength of each location. Standardized performance reporting allows regional and marketing leadership to make accurate portfolio-level comparisons and prioritize resource allocation toward the highest-opportunity underperformance situations.
{What is the typical timeline to see improvement after intervening at an underperforming cannabis location?}
The timeline to see meaningful performance improvement after intervention at an underperforming cannabis dispensary location depends on the type and severity of underperformance and the nature of the intervention. Marketing interventions such as increased local advertising and Google Business Profile optimization typically show measurable traffic improvement within four to eight weeks as campaigns reach frequency and new search visibility takes effect. Operational improvements such as staff training and customer experience redesign show improvement in conversion rate and average order value over a similar four to eight week window as the new practices become consistent. Retention campaign reactivation of lapsed loyalty customers produces the fastest measurable impact, often within two to four weeks of campaign launch, because it reaches a known audience with demonstrated purchase intent.]
Webinar Highlights
00:00 - The MSO Performance Management Challenge
The session opens by establishing why performance management across a multi-location cannabis dispensary portfolio requires a different analytical approach than single-location management, including the normalization requirements and root cause diagnostic frameworks that distinguish genuinely underperforming locations from those facing genuine market headwinds.
08:00 - Building the Normalized Performance Dashboard for MSO Portfolio Analysis
This section covers the specific metrics, normalization methodologies, and dashboard architecture that give MSO leadership an accurate comparative view of all location performance, enabling proactive identification of underperformance before it reaches severity levels that require major intervention.
18:00 - Diagnosing the Root Cause of Cannabis Location Underperformance
The webinar covers the diagnostic framework for identifying whether a specific location's underperformance is driven by market-side factors, operational execution gaps, or marketing investment insufficiency, and how the diagnosis determines the appropriate intervention strategy for each underperforming location.
26:00 - Marketing Interventions That Drive the Fastest Location Performance Improvement
This section covers the specific marketing tactics that produce the fastest measurable performance improvement for underperforming cannabis dispensary locations, including local digital advertising campaigns, Google Business Profile optimization, loyalty reactivation campaigns, and review generation programs that improve local search visibility.
34:00 - Building Ongoing Location Performance Monitoring for MSOs
The session closes with the performance monitoring infrastructure and review cadence that allows MSOs to maintain continuous visibility into location performance across the portfolio, identifying emerging gaps early and allocating marketing investment dynamically to locations where incremental spend will produce the highest incremental return.
Frequently Asked Questions
[ {What is a normal revenue range for a cannabis dispensary?}
Cannabis dispensary revenue varies enormously by state, market maturity, competitive density, location characteristics, and operational execution, making a universal "normal" revenue range of limited usefulness for individual operators. In mature legal markets with high competitive density, individual dispensary annual revenue ranges from a few million dollars to tens of millions for high-performing flagship locations in prime markets. In newer legal markets with limited license availability, individual dispensary revenues can exceed those in mature markets due to reduced competition. MSOs evaluating their specific location performance should benchmark against the market-specific competitive landscape rather than national averages, as market context is the most important determinant of what revenue level is achievable for a specific location.
{How do cannabis MSOs allocate marketing budget across locations?}
Cannabis MSOs allocate marketing budget across locations most effectively through a dynamic allocation framework that weights budget toward locations where incremental marketing investment will produce the highest marginal revenue return. This means directing above-average per-location budget to underperforming locations with identified marketing investment gaps and market potential that exceeds current revenue, maintaining baseline investment at performing locations to sustain competitive visibility, and directing below-average per-location budget to locations that are already capturing dominant market share where incremental marketing investment produces diminishing returns. The allocation should be reviewed quarterly and adjusted based on location performance trends rather than maintained as a fixed per-location formula throughout the year.
{What competitive analysis should cannabis MSOs do for underperforming locations?}
Cannabis MSOs should conduct location-specific competitive analysis for underperforming dispensaries that covers competitor count and proximity within the relevant drive-time zone, competitor review ratings and review volume as indicators of competitive brand strength, competitor pricing positioning and promotional activity as indicators of pricing pressure, competitor online ordering availability and delivery service as indicators of ecommerce competition, and competitor social media and local marketing activity as indicators of marketing investment intensity. This competitive profile helps distinguish underperformance caused by genuinely tough competitive conditions from underperformance caused by insufficient competitive response to a market environment that is beatable with the right marketing investment and operational improvement.
{How does cannabis loyalty data help MSOs manage location performance?}
Cannabis loyalty data helps MSOs manage location performance by providing customer-level behavioral visibility that aggregate revenue metrics cannot reveal. Loyalty data shows customer visit frequency trends at each location, whether frequent customers are visiting less often than historical baseline, whether new customer enrollment is growing or declining relative to market population, which customer segments are churning and at what rate, and how the location's loyal customer profile compares to high-performing locations in the portfolio. These behavioral signals often provide earlier warning of emerging performance problems than revenue metrics alone, because customer visit frequency and loyalty enrollment changes precede revenue impact by weeks, giving MSO teams time to intervene with retention and acquisition campaigns before the revenue gap becomes severe. ]
Cannabis Podcast Full Transcript
[ {How to identify and boost underperforming locations}
good morning and thank you for joining us we will get started very shortly here just give a couple more minutes for the other attendees to join us thank you once again for taking the time out of your day good morning thank you very much for taking the time out of your day to join us on this webinar we will be getting started here in just a few seconds uh just giving a couple more minutes here for the other attendees to join us wonderful thank you once again for taking the time out of your day to join us today we're going to be discussing how to identify and boost underperforming multi-store locations we're also going to be discussing how to strengthen your weakest link and get more sales out of individual locations if you're just joining us once again we are foot traffic um we are a digital marketing agency covering all legal states medicinal recreational and delivery in the united states along with canada we're going to be discussing how to increase overall value in all locations this is certainly one item that we find customers with multi-state operations and or stores in different regions of the same state can sometimes have different marketing strategies so in just a moment here um give it just another 30 seconds or so to kick start if you're just joining us thank you once again for taking the time out of your day we certainly appreciate it and let's get underway so in our agenda today we're going to be covering the metrics you need to check across all of your dispensaries how to use that data to create unique strategies per location and the highest roi tools that will boost your sales my name is eduardo silva i will be your host here today i have overall 18 years in marketing and sales experience so i'm hoping to share some of that experience with you and if you're uh joining us from outside of california if you wouldn't mind uh just getting familiar with the interface and i certainly always like to start by knowing where you're joining us from there is a chat window there if you want to just type in there where in the country and or if you are in canada which province you're joining us from that would be great and i always like to start with this trick question where in the world is this beach located let's see who can guess it first wonderful we have bc canada thank you so much for joining us perfect let's talk a little bit about foot traffic and a little bit of a background so foot traffic as i mentioned a little earlier we're a digital marketing agency we cover over 20 states including canada we provide digital marketing services i like to really introduce ourselves as a digital marketing agency that focuses solely on the revenue driving for the digital marketing as well as marketing analytics those are our core competencies if you will and so with that being said having such a broad uh understanding and experience with different markets for cannabis we bring a lot of experience to the table and we love to share that information with you today a couple housekeeping items here if you are not so familiar with zoom i imagine that most of us are by now please do take a moment to just familiarize yourself with the zoom interface there has been an update so even if you are familiar perhaps it is a good way to just navigate around go to the top of your screen find that q a button we do have panelists here that's going to be assisting and addressing questions throughout the webinar we're going to be moving fairly quickly as well so there's a lot of content to cover so i do ask that you mute your cell phones that way you can avoid distractions and absorption a lot of this material faster thank you once again for your time and let's jump right in first step in you know creating this multi state or multi location strategy is diagnosing problems so are you able to currently understand what your data is telling you per location are you comparing the right metrics to get the best picture of how your dispensaries are performing between your pos system crm sms platform google data studio it's easy to get overwhelmed by the amount of data that we can collect so if you're suffering from information overloads overload or confused about what to do with all those numbers we're going to dial into the key productivity indicators that's kpis that you need to focus on to better identify underperforming locations and determine the best way to boost them an underperforming store threatens the viability of your brand if you want to succeed in the industry you need to identify them as soon as possible so your team can work on turning them around and to do this you do need the right information so let's talk about that first you need to know your market right before diving into the kpis you should be tracking we need to talk about the markets where your dispensaries are located before opening up a dispensary your team likely analyzed the viability of the location before securing a lease or building up out your store
{Diagnosing the problem}
that same information can be useful for defining the addressable market your addressable market is the potential customers within a certain distance of your dispensary if this information is more than five or ten years old it may be worthwhile to take another look since populations do change over time to determine your addressable market take a look at the age of the population within the 10 mile radius of your dispensary for suburban dispensaries this can be as much as 20 miles for medicinal dispensaries you will want to focus on eligible patients you also want to evaluate the competition how many dispensers are located near you what about the delivery services every competitor is fighting for a slice of that addressable market which means that the more competition there is the harder it will be to carve out your slice of the pie unless you expand your service you can't change your addressable market and unless you have a magic wand you can't make the competition disappear you can however improve your in-store experience and expand your marketing to get more customers and get more sales at an underperforming store if you need help understanding your customers we offer a customer profile services that details the demographics of your market we have two packages on this we have a one thousand dollar standard package and then we also have a five thousand dollar premium package now these packages show you everything behavior in terms of consumer purchasing behavior for cannabis age demographics also involving average household income anything that is really crucial for you to understand that addressable market and if you want to find out more information about these reports feel free to text profile to 411 669 and we'll put that information here in the chat window as well so you can have it as we go continue forward let's talk about in-store kpis that you need to track over time to be able to first identify an underperforming store and the issues he may be having you want to measure and track your foot traffic the number of transactions you do daily your average transaction total units per transaction your average unit price gross in that profit and the loyal the number of loyalty members associated with the location the number individuals who have opted in to your marketing messages and your online versus import in-person sales now that sounds like a lot of different metrics and we'll actually post those for you later as well so you can always refer back to it you will also want to measure your gross margin for every location your gross margin is your net sales minus your cost of goods sold once again gross margin your net sales minus your cost of goods solds this will help you determine how much your dispensary is making after covering your costs if your gross margin is too low you are not making enough profit to be sustainable and you either need to adjust your pricing or reduce your overall expenses your product sell through rate is a percentage that compares the units of sales to how much product you have on hand okay how quickly your moving products help you determine whether you're carrying what your customers want if you can break this down by brand and product type you can invest more in the types of products that get sold quickly so very important as well year-over-year sales provide insights into your dispensaries growth by comparing current sales with the previous year sales now comparing that percentage of growth across all of your locations can help you find stores that aren't growing as quickly so you can investigate their performance further another great metric here to track is sales per square foot which allows you to determine whether you're making the most out of your space by dividing your sales by the square footage
{Gross margin}
of your store you can see how much you're making per square foot this number allows you to compare across your locations so that you can better identify any differences between them that may be impacting your sales like product positioning and marketing factors as well for your set market when coming up with this number don't count your waiting area or security area only count the square footage of your selling space your average spend clues you in to how much people are spending at your dispensary in general if a store has a lower average spend you can look into how many average units per transaction they are selling or see which products are more popular to find out why it's lower it may be necessary to coach butt tenders to upsell cross-sell so that they have useful recommendations that increase your average spend per customer also consider how products are displayed are they tempting your customers to buy them are your bundling products are you bundling products that go together all of these kpis should be tracked and compared both within the store itself and across your other stores as well you can do this easily
{Sales per square foot}
in a spreadsheet if you have fewer locations large msos however may choose to create a report via their pos system or have proprietary software built that creates these reports automatically which is pretty standard in the retail sector once you have these numbers you will be better able to compare stores in different locations for online sales the kpis are very very similar to the ones we just discussed though you will be tracking how many people are going to your website i like to think of a website as your virtual store okay so where they are coming from is very important meaning where is your customers coming from
{Average spend}
how many are ordering the average transaction total the units per transaction and how many are loyal members choosing the correct online menu is crucial since most online menus in the cannabis industry do not offer revenue attribution okay again this info can be gathered and aggregated the same way as in-store kpis having in-store and online data side-by-side can help you better diagnose why your store is underperforming perhaps it's doing fine with online sales but not many people are stopping by maybe it's the other way around you will know you won't know this unless you're collecting these data points and looking at them regularly so what do we do with all of these kpis right what are they telling us remember you can collect all of the data you want but if you don't know how to read it or use it to your advantage it doesn't matter you will be wasting your time so because the size of the markets may vary across your locations tracking these metrics will allow you to compare across all of your locations regardless of where they're located if your location has been open for over a year and you're you've got no historical data or you do have historical data in this case you can look at your year-over-year increases to see if they are similar across the board if a location isn't growing as quickly or if it's performing worse than it did in previous year then you can take a further look at different metrics you're collecting right so you can see if you can spot any additional issues now that you know how to identify underperforming stores it's time to address the issue certain metrics will inform you that the problems of your dispensary may be facing are very much specific to a location okay for example if one of your stores has a lower percentage of loyal opt-ins boost that number by help by uh may help you increase your overall customer retention so for example if you do have right a tracking mechanism for your loyalty opt-ins
{Reading the metrics}
then and you spot that there is a lower percentage per a store you can boost that if you're not able to retain customers you will have to keep spending money to get new customers and building relationships with customers is vital for your business longevity and will result in more sales or if your reviews are suffering at one location which can have a direct impact on your sales then you can work with store managers to improve customer satisfaction and implement better reputation management strategies perhaps that location isn't training its blood tenders to your stores okay and the morale issue could be also a factor here right so making sure that you're paying attention to reviews going to be very important for your overall bottom line so your kpis won't diagnose the problem for you but they are symptom of a larger problem by honoring it
{Boost sales}
on those symptoms you have a better shot at correctly identifying the issues facing your location and finding ways to address them ultimately your dispensaries don't face the same challenges which means that what works at one may not work at another in order to maximize each location's visibility and connect with possible customers you must create individual marketing strategies that address the unique needs of your dispensary locations a one size fit fits all strategy will guarantee that you are having underperforming stores your audience is not the same for all of your dispensaries and you should not treat them all as if they are otherwise you are missing the opportunity to create relationships and build your brand locally based on the metrics and the data that you have about your market you can create a digital strategy to help boost your brand awareness and drop more traffic to your underperforming locations the following tools can be used to create a hyper local marketing campaign that will draw more people to your underperforming store and start boosting your overall business so let's jump in first and most importantly one of the most widely recognized ones is geo advertising which is sometimes called geo ads it is the use of display ads on a mobile device within a set geographical region you're definitely seeing these before while browsing on your phone plenty of companies outside of the cannabis industry use them to increase their reach including amazon wayfarer and several others why because geo ads allow you to connect with new customers in your target market online display ads
{Individual marketing strategies}
help you keep your dispensary front and center with your customers once they enter one of the perimeters you created for your ads they will see your ads if they use one of the mobile sites and apps within that network they can click back and go directly to your online menu there are different ways that you can use geo ads to your advantage you can focus on your service area you can target competitors you can even target areas where your customers are likely to be another great way to get people to your store is the use of text message marketing text messaging is the most widely used communication channel available today not everybody uses email or makes phone calls regularly anymore but about ninety percent of people text that means that your customers text and that you need to be using sms marketing as part of the digital marketing strategy to communicate with your customers where they are text messages uh in text message marketing should be a part of how you communicate with your customers and offer deals provide them opportunities to opt in at your pos and on your website and don't forget to make it exciting joining a vip program is more exciting than just getting a text message by creating a unique link that you sent to your sms subscribers you can also track who clicked the link and how many sales it led to not only is sms marketing inexpensive but it helps you increase sales and build relationships with customers the last tool many customers come to us and are sometimes surprised because mainly because it's been around for so long and it's generally taken for granted this is seo if you have multiple locations you need to ensure that your seo strategy focus on each location individually if you're not seeing enough traffic to your website or menu you should consider whether your seo strategy is working if you don't have an seo strategy that focuses on your local store you need to create one seo stands for search engine optimization which in the practice it's increasing the quality and the quantity of traffic to your website through organic search engine results organic traffic is one of the largest drivers of traffic to many of our clients websites and this is unpaid traffic that comes from google search engine optimization shows that your page is relevant to particular keywords in our business that may be san diego dispensary detroit provisioning center or santa rosa marijuana delivery optimizing your site around these keywords makes it more likely that people who are looking for some of these services that you are offering will find you when you have a good seo strategy two things will happen one you will show up higher in the search results and two you will get more organic traffic in fact the top three results of a search tends to get 75 of all of the traffic the lower you are in the search results the less traffic you will get more than half of our clients online sales come from organic traffic their seo strategy have more than shown their value and exceed their expectations time and time again one of our clients seo roi currently is at 93 dollars for every dollar spent on seo this is a no-brainer are you finding out about issues after the fact gathering information because sales are already suffering if you're tracking the wrong information or just not tracking at all you're going to be blindsided and you may not notice the problem until it's too late to implement a meaningful change you need to make sure that you have the right technology in place and it is working for you and set up to track the metrics that will give you the best picture of your dispensaries performance and you need to have individual marketing strategies in place to address the various challenges each of your locations face including offering markets and customers so we do have a strategy and a offering today that we're going to be launching for new customers only and this is 500 online orders for sixteen hundred and fifty dollars per month for three months okay so that's 500 online orders for sixteen hundred and fifty dollars per month for three months that means that we will use a combination of strategies here to advertise your business and get conversion done on your website okay so your online menu great opportunity uh to earn new customers and jump into digital marketing without having to break the bank so with that being said i'm going to turn it back over to questions any questions from the audience today feel free to use the q a panel on the top of the screen there on zoom and we'll go ahead and address
{Get tracking}
those questions live all right one great question here we're tracking online is there anything you need in particular great question so for tracking online there are a varying um amount of tools that can be used the first and the most important is the proper selection of an online menu do keep in mind that because our industry is still maturing there are a lot of online many technologies that do not offer the capability of tracking the proper source of the audience that is routed to your menu so this is crucial first step why is that without that proper tool you're not going to be able to sync it to a google analytics dashboard okay where we're going to be able to see exactly where your sources of revenue are your drop-off rate how many people are actually abandoning your cart right as they're going through the ordering cycle as well as your conversion rate you may have a store that has a really high conversion rate on their menu perhaps above 10 percent which is
{Questions?}
very much instrumental to running an e-commerce business but you won't know and you won't be able to make the necessary investments there so one selection of the online menu having a proper website that is one speedy for the for the client right as they're browsing through and doesn't offer any challenges for that consumer right you want to convert the consumer once they come to your online menu you want to make sure that their experience is very much fluid thank you for that question great question we create different campaigns for different mso locations absolutely the first and most important aspect of creating a campaign for a different mso locations multi-state operators right is identifying the target market understanding the behavior of that consumer what is the saturation right do you have a lot of competitors what is your total cost per acquisition uh in that location or what is your cost per click right if you're running a digital marketing so all of these are factors that we take into account when building a marketing strategy for you and quite frankly there is no um cookie cutter approach that can be done for multi-states this has to be done strategically but the great thing is that foot traffic we have so much experience working across every single state that we can launch a campaign for you in what would probably take you six months to nine months to really design a proper campaign and understand the behavior we can do that in in less than 30 days sometimes in just a week so definitely get in touch with us we're happy to to discuss that with you offline as well if you have a specific case you would like to run and we'll be happy to recommend wonderful so uh one last question here we'll turn it up to some closer remarks but what products would us what would foot traffic recommend for canadian dispensaries and i'm assuming here that the question is relating to different digital marketing products or different digital marketing strategies first and foremost um seo will certainly be a big uh influence in any online uh e-commerce play right so your digital marketing uh strategy should be encompass seo because as we discussed here today it is one of the biggest drivers it is a longer term investment however it is one of the biggest revenue drivers for every single one of our customers at embarking seo some of our customers are seeing up to 93 dollars return on every dollar spent it's unbelievable so seo certainly google ads we run google ads successfully and compliantly in canada in any state in the united states and this is a great way to drive new customers capture new market and then geo ads is also very important geo ads uh i think those three would be the biggest drivers i would say for new customer acquisition and then finally sms is really a loyalty driver right so if you don't have a a proper sms strategy which integrates directly to your marketing strategy you may be at a loss there because you're going to be continuously purchasing new customers when you can also further enhance your relationship with your existing customers great questions thank you so much for for asking those and uh with that being said um also for sticking around with us you have qualified for a free yeti tumbler for those of you in the united states we do not ship those internationally yet but if you have stuck around with us as you did please do get in touch with us here is the link for traffic dot me forward slash call let's schedule a quick call and let's uh let's get your your free yeti to you i want to thank you once again for taking the time out of your day we certainly appreciate it and we hope you have found this information very helpful and once again if you would like a individual strategy built around one of your locations if you have a use case we're happy to help have a wonderful rest of your day and please do stay safe out there have a great one ]
Read More
Featured Speakers
Related Cannabis Podcasts
The Anatomy of a High-Engagement Instagram Post
Creating a Marijuana Delivery Service Marketing Strategy
Webinar Highlights


Other Ways to Enjoy the Cannabis Podcast
.jpg)

This is some text inside of a div block.