

$145K IN.
3X BACK.
9X FORECAST
How one multi-state cannabis operator built 1,651 new customers and 3,686 reactivations into a measured 3x return, with 9x forecast as those customers repeat.
Let's TalkGrowth hurdles that needed
proof, not vanity metrics.
The MSO needed measurable incremental revenue, proof of performance beyond natural market growth, and a clear path to long-term customer value.
Auction Plus made every dollar
work harder.
Flexible full-funnel activation, expanded audience targeting, and transparent cost-plus pricing gave the campaign more reach, more control, and less waste.
Six months. Nine locations.
One measurable growth engine.
Precision audience segmentation and creative optimization were informed by real-time performance data throughout the campaign.
A $145K campaign became over
$1.3M in projected revenue.
The campaign drove growth at every stage: new customers, reactivated buyers, and accelerated purchase frequency.
revenue
AOV
6-month value
revenue
reactivation
AOV
purchase
patterns
purchases
behavior
than controls
powered ROAS
Each cost figure allocates full campaign spend to that outcome. Spend was not divided between acquisition, reactivation, and frequency.
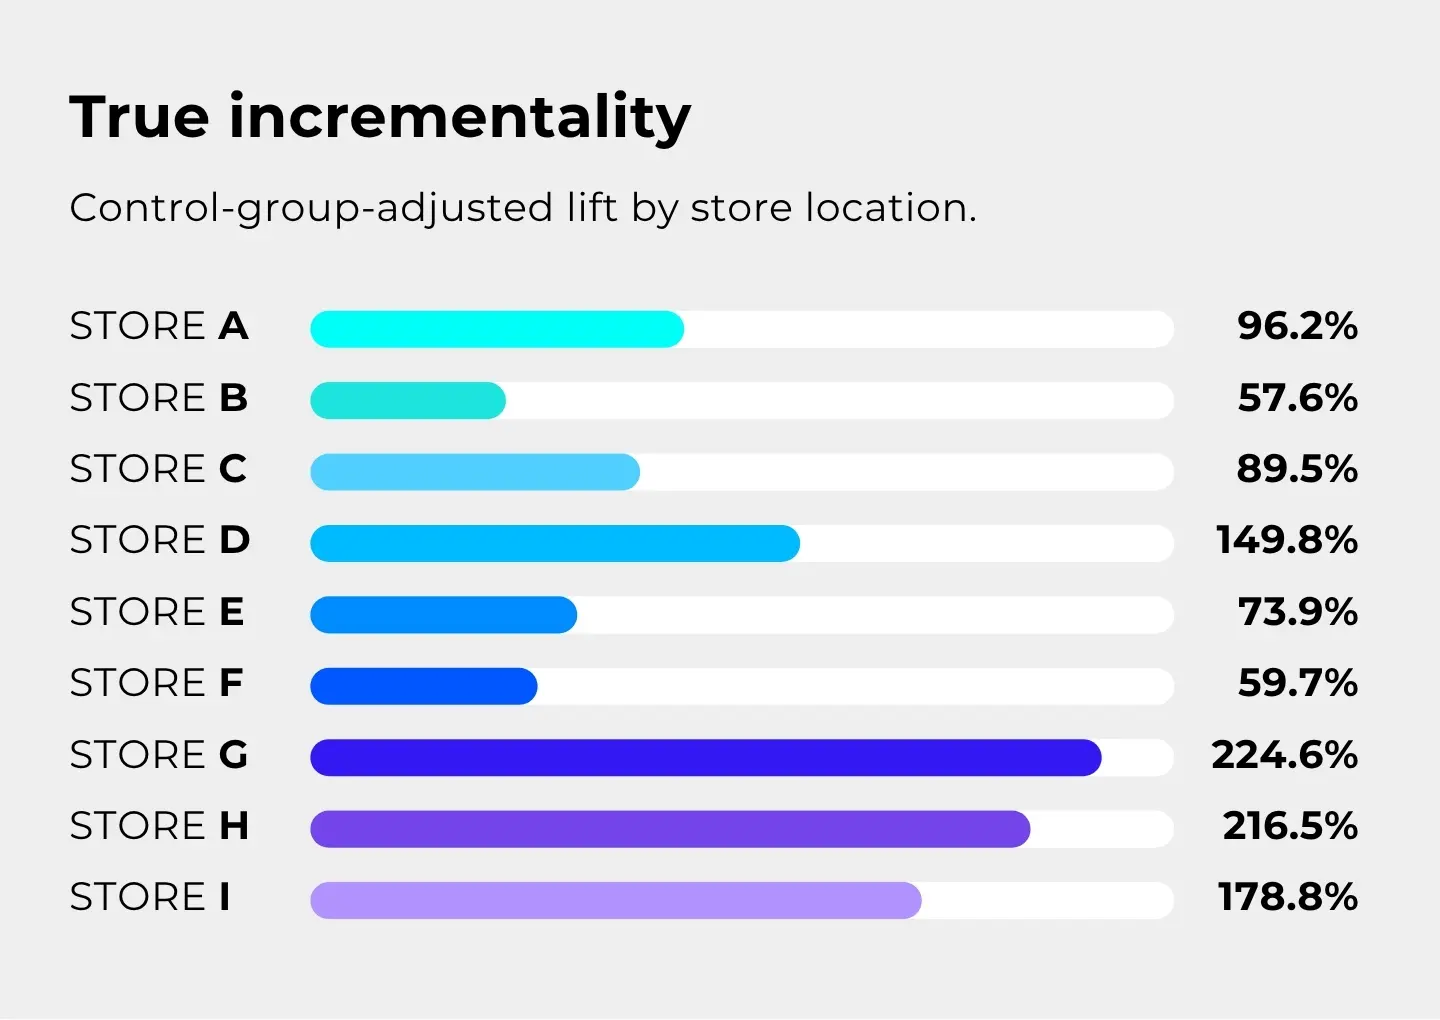
Performance varied, but multiple stores exceeded 200% true incrementality.
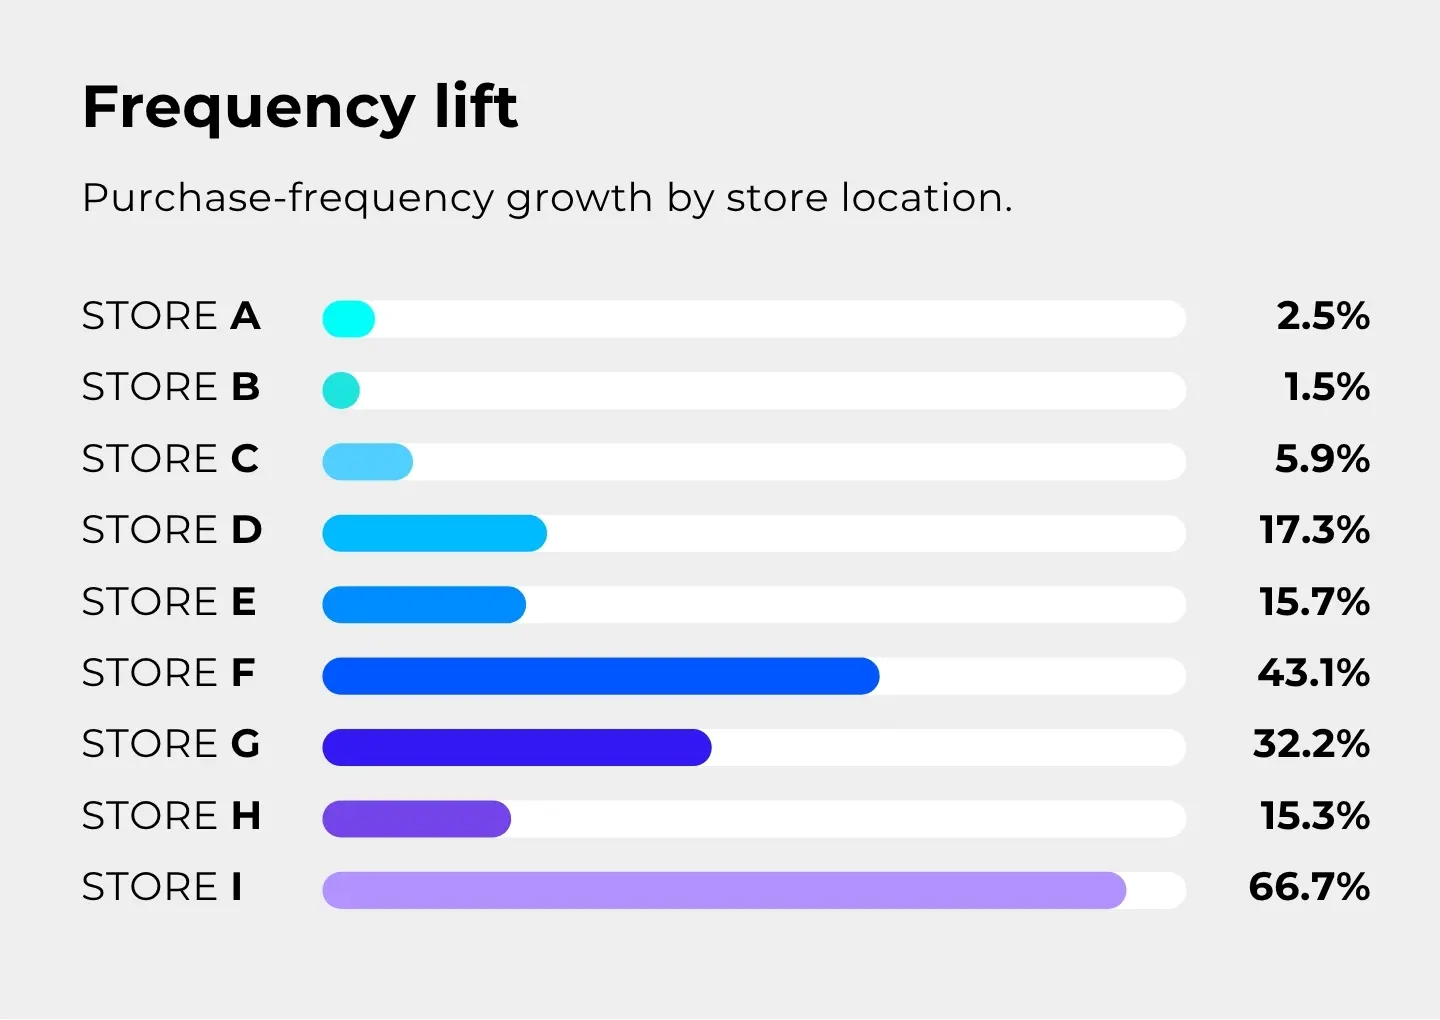
Individual store incrementality ranged from 57.6% to 224.6%, while frequency lift reached as high as 66.7% in certain locations.
A $145K campaign became over
$1.3M in projected revenue.
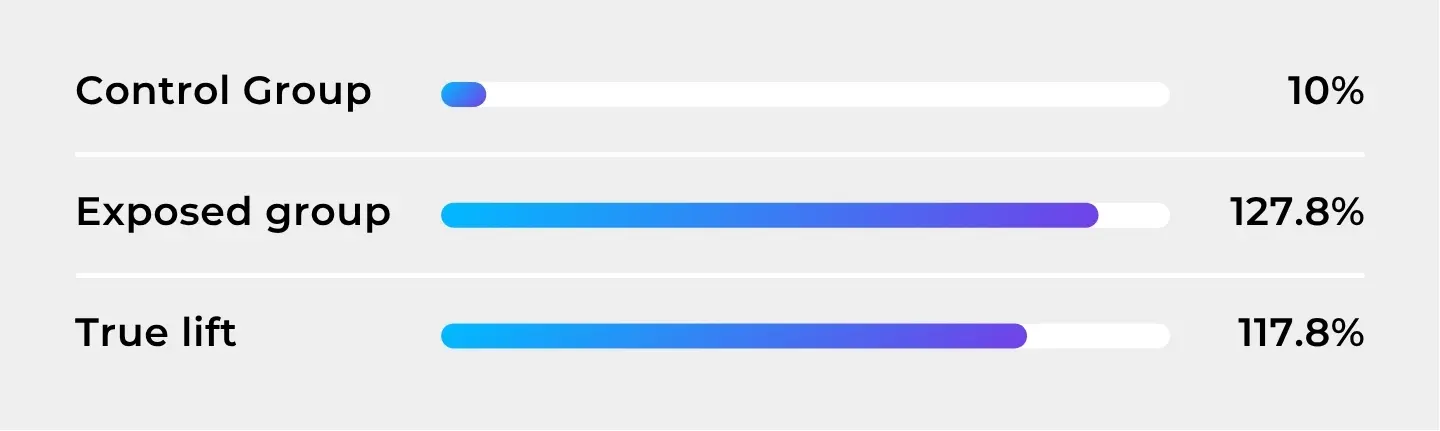
Unlike inflated metrics from natural seasonality or market growth, Auction Plus measured true lift by benchmarking exposed customers against non-exposed control groups.
This proved revenue gains were directly attributable to the campaign, not external factors.
Optimization connected media exposure to business growth.
Auction Plus did not just generate clicks and impressions. It mapped the path to customer acquisition, winback revenue, and purchase acceleration.
The takeaway
Transparent, full-funnel programmatic advertising can unlock scalable, profitable growth for cannabis retailers.
Transparent partnership. Greater reach and impact.
Cost transparency, broader audience coverage, and performance-focused delivery create a growth-aligned media model.
1.79x
CPM pricing at actual cost, with no hidden markups and full budget transparency.
2.23x
$25K+
Superior results across key performance indicators and engagement metrics.
100%
Audience expansion beyond cannabis intenders into local, lifestyle, wellness, and transition segments.
Turn media spend into measurable customer value.
Nine stores, six months, and every dollar tracked to a transaction. If you want this level of measurement on your own spend, let's talk.