CASE STUDIES: New Dispensary

How We Generated
351% ROAS in 30
Days and 6X ROAS
in 3 Months

How a new dispensary used audience data and programmatic display to win first-time customers in a crowded local market, then bring them back.

Let's Talk
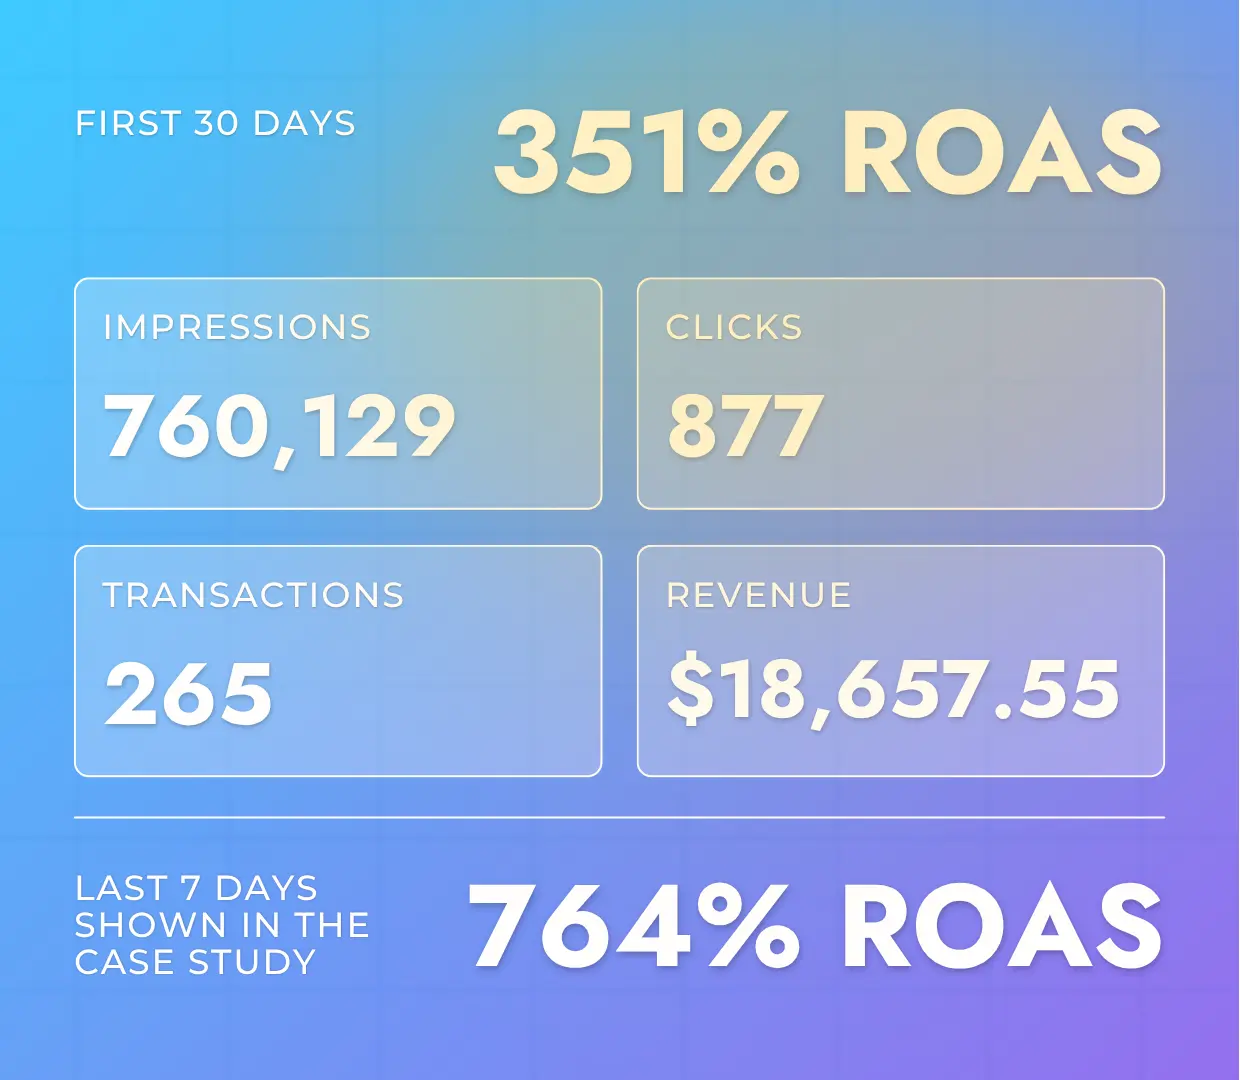
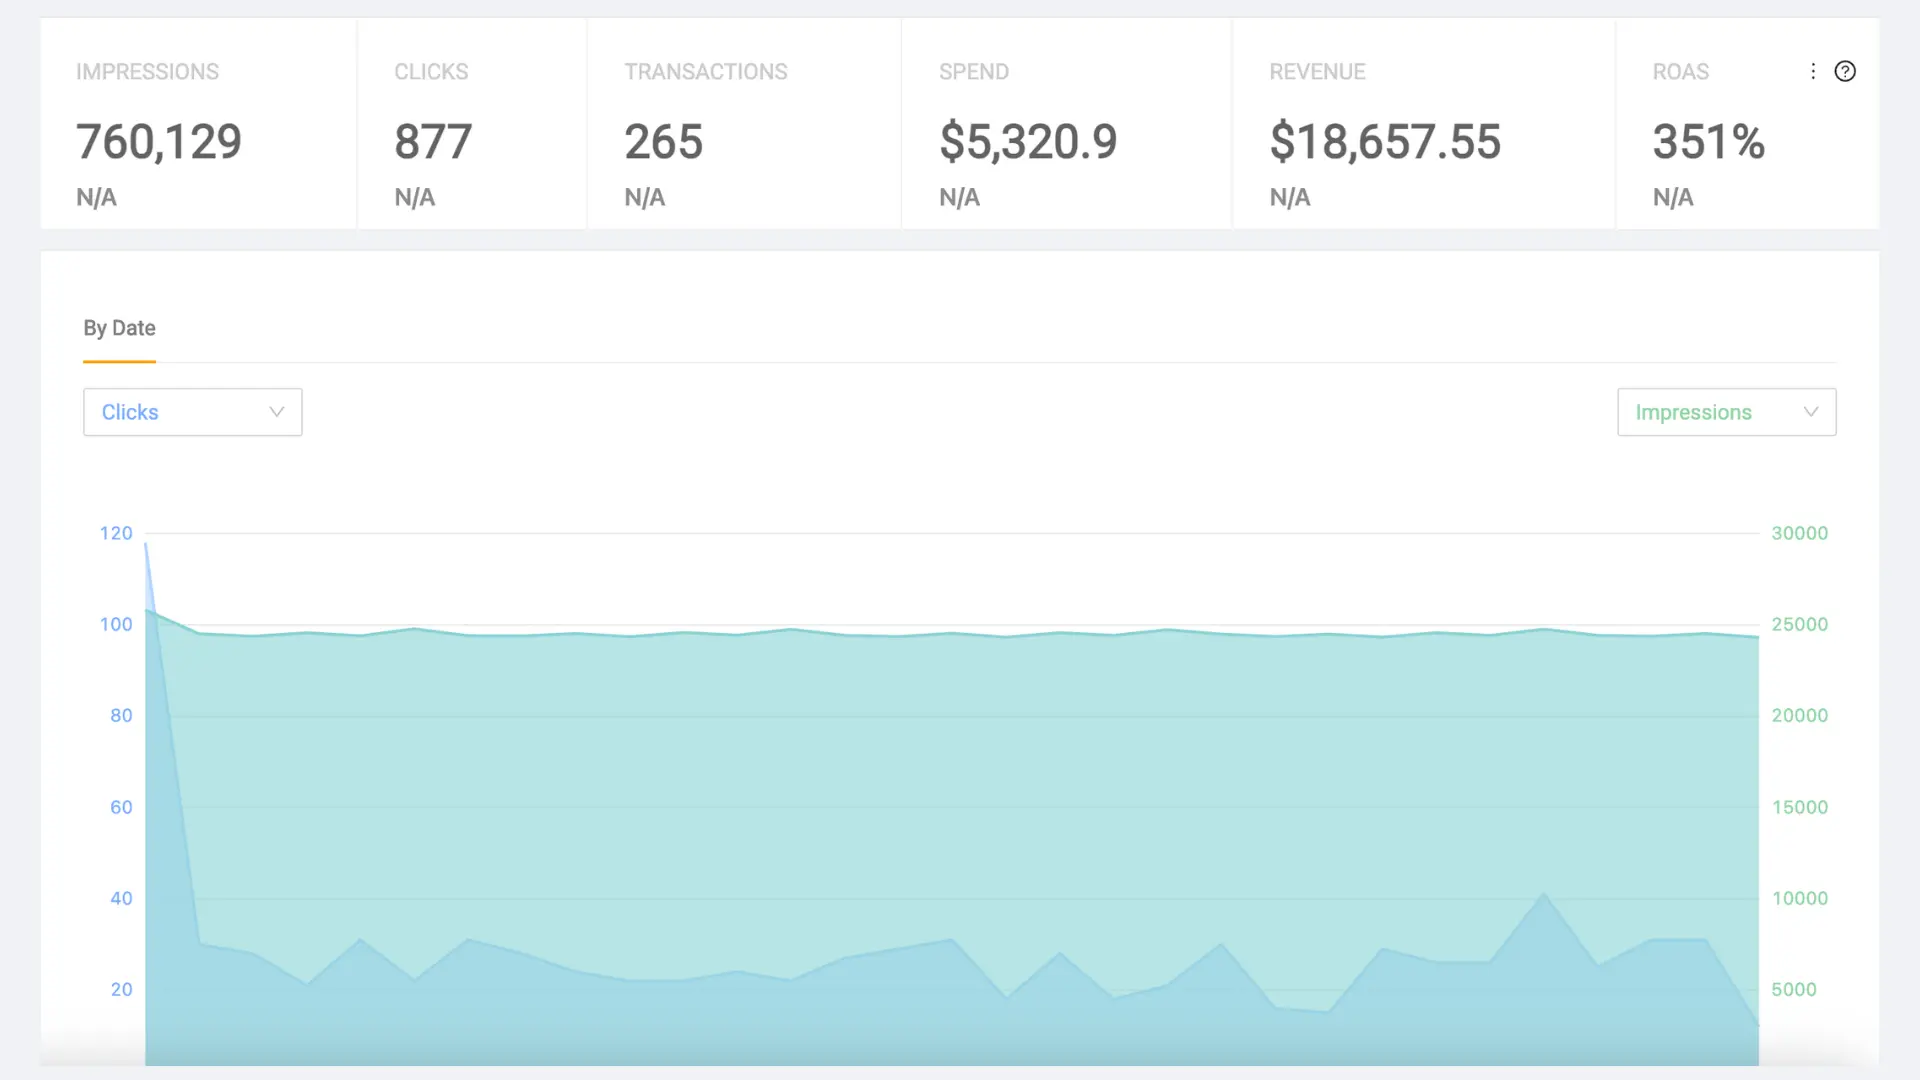
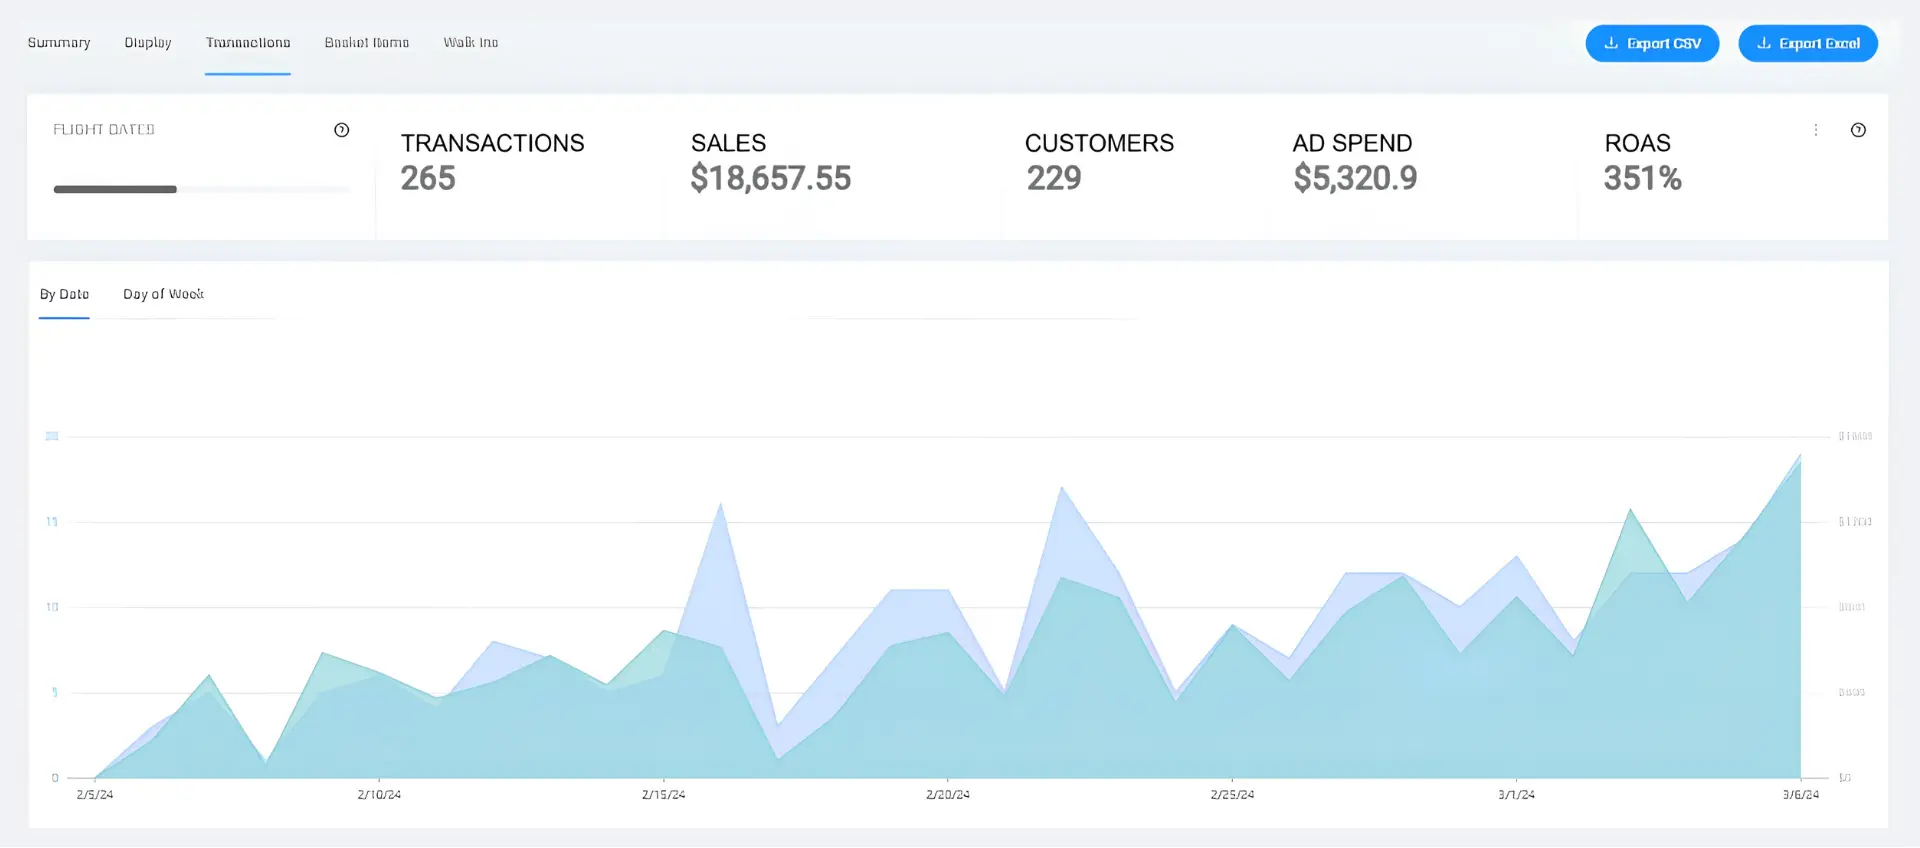
First month of the campaign
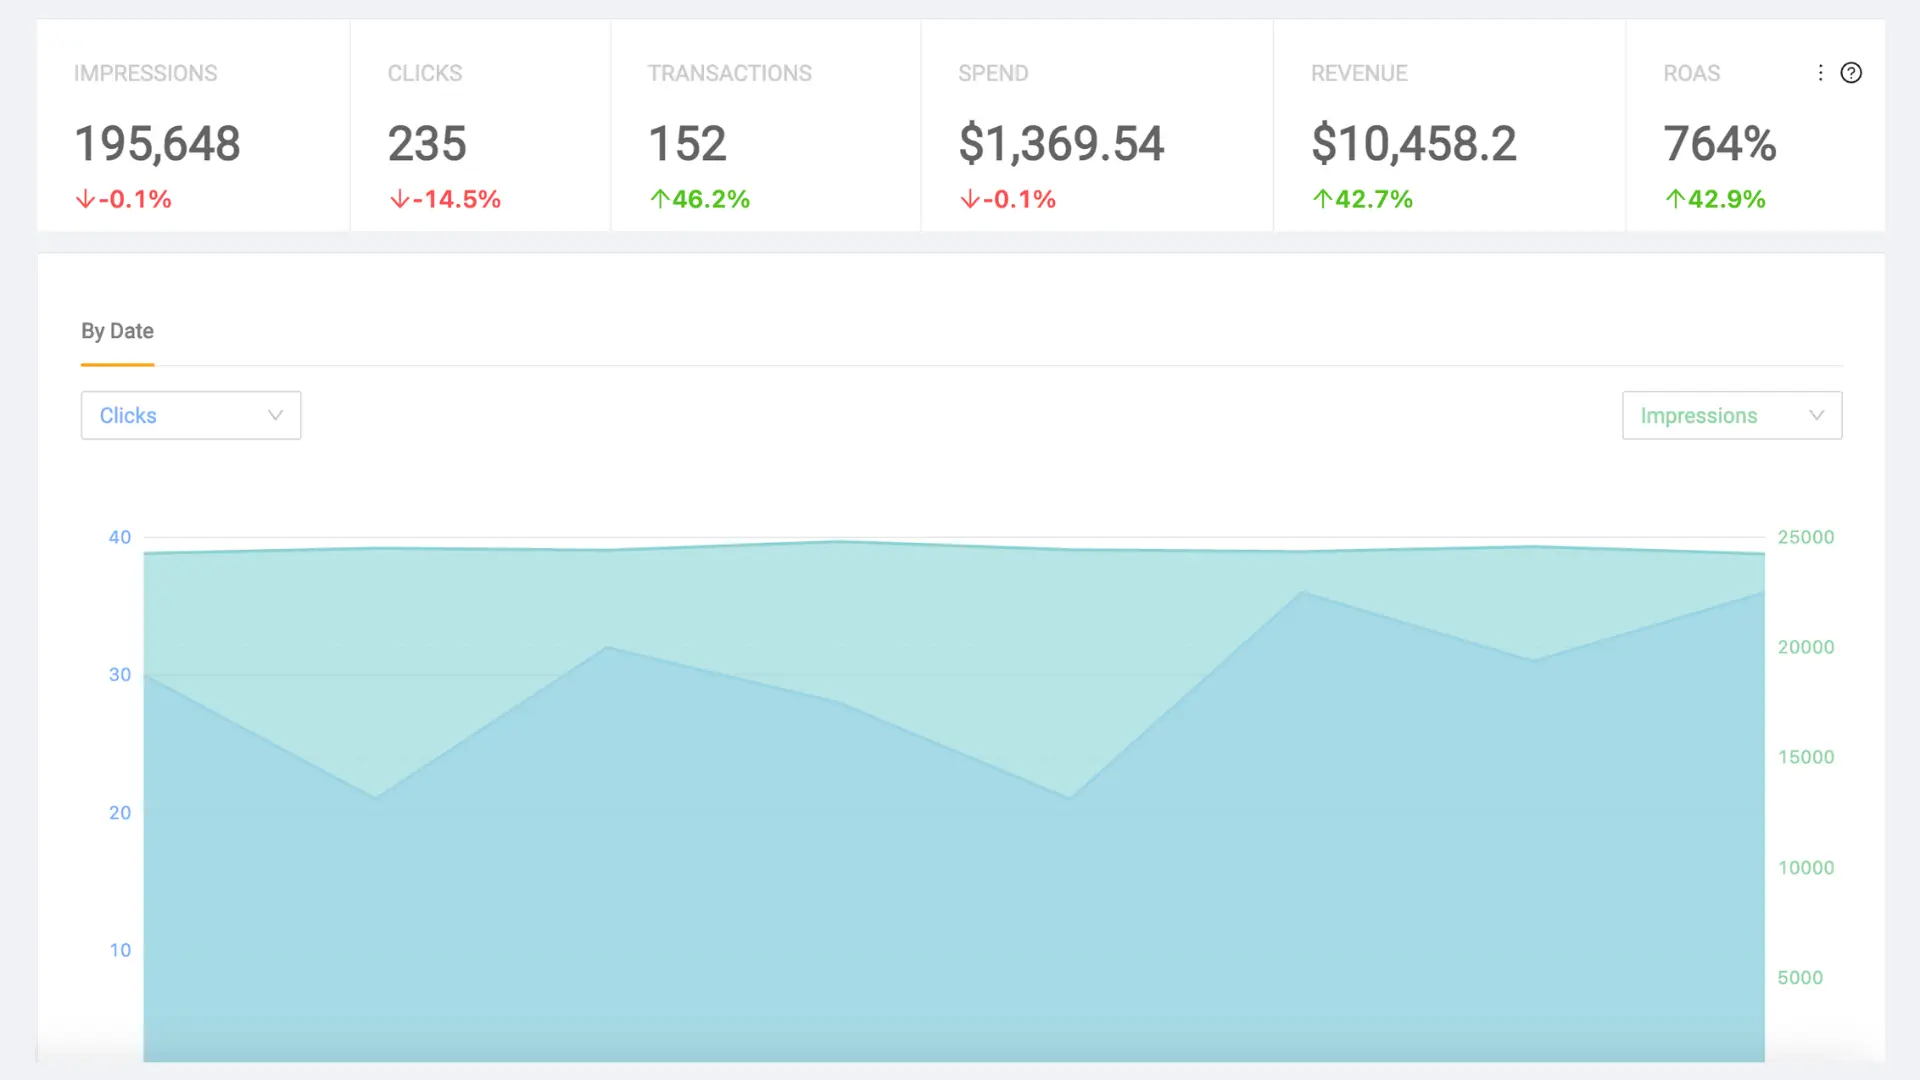
Final seven days of the campaign
THE SITUATION

A new store in a market that was already crowded

A new dispensary opened its doors in an already competitive market. They sought to establish brand recognition, attract new customers, and ensure loyalty with repeat visits.
PROBLEM
GOAL 1: Drive precision-targeted traffic
Reach valuable local audiences and move them to
the eCommerce website.
1
GOAL 2: Increase transactions and repeat purchasing
Turn prospects into customers, then reinforce
loyalty with repeat visits.
2

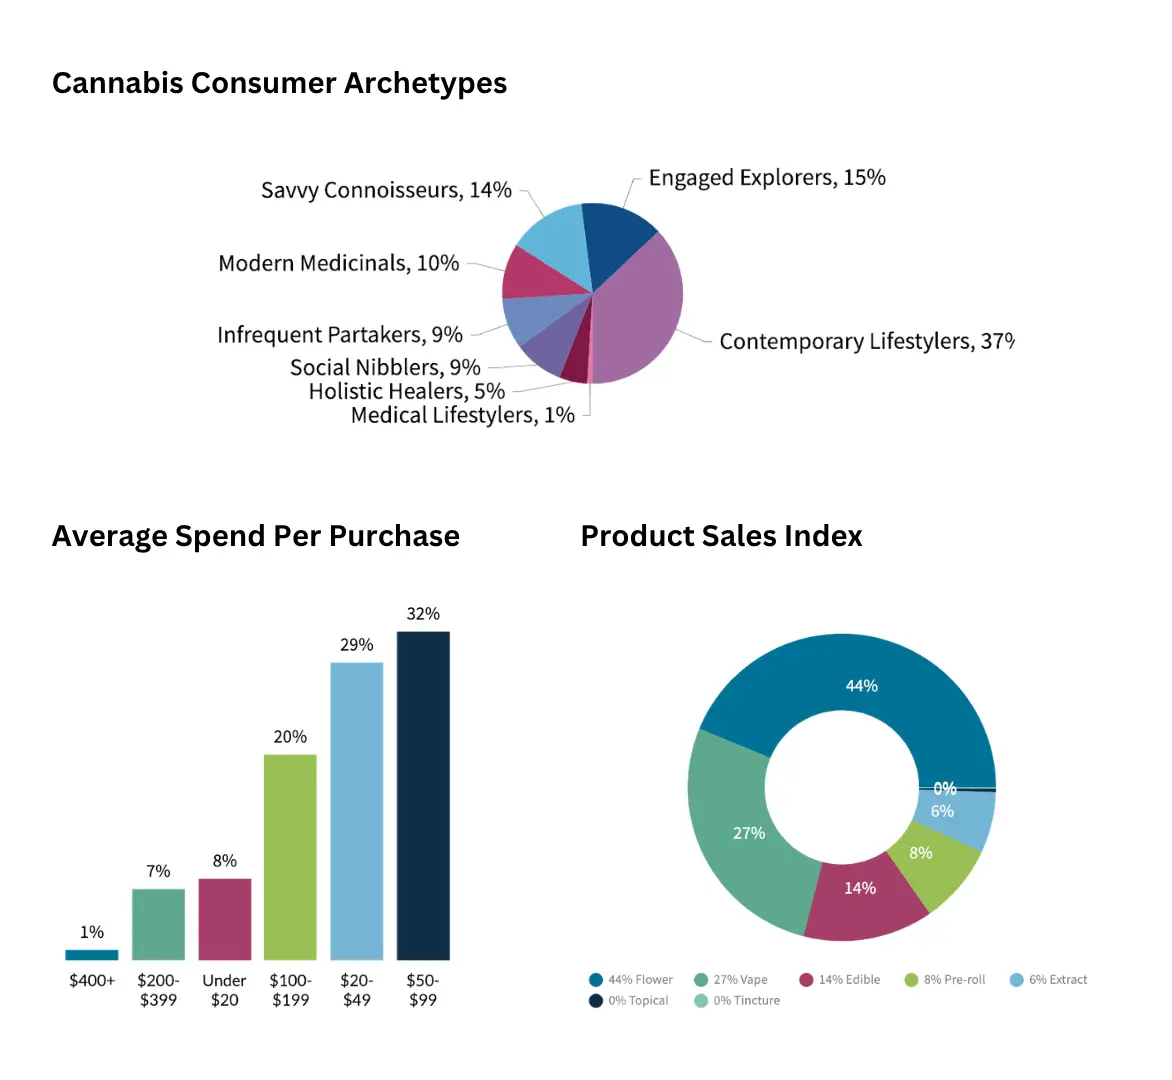
What the audience data showed us

We harnessed market data to tailor campaigns, optimize targeting, and maximize ROAS‍Consumer insights helped shape demographics,
behaviors, personalized content, timing, channels, and
messaging. Continuous testing and feedback then
supported stronger engagement and retention.

01
We started with four signal types: contextual, local news, lifestyle and wellness, and purchase intent.
02
We matched creative and delivery timing to the segments that were converting.
03
We rewrote messaging around what first-time buyers were actually looking for.
04
We cut the two segments that weren't converting and moved the budget.

How we ran it

Built The Audiences
We used DemoGraph Audience Builder to build the store's opening local segments from contextual, lifestyle, and intent signals.
Ran The Delivery
Display ran through the self-service ad platform, across the websites and apps this store's local audience uses daily.
Bought On CPM, Not CPC
Buying impressions instead of clicks let the budget cover the whole local audience, not just the people already searching.
Read It Weekly In DataJel
Weekly reporting is where the creative and budget calls came from, including the week-three audience change.

What the pixel showed
that clicks didn't

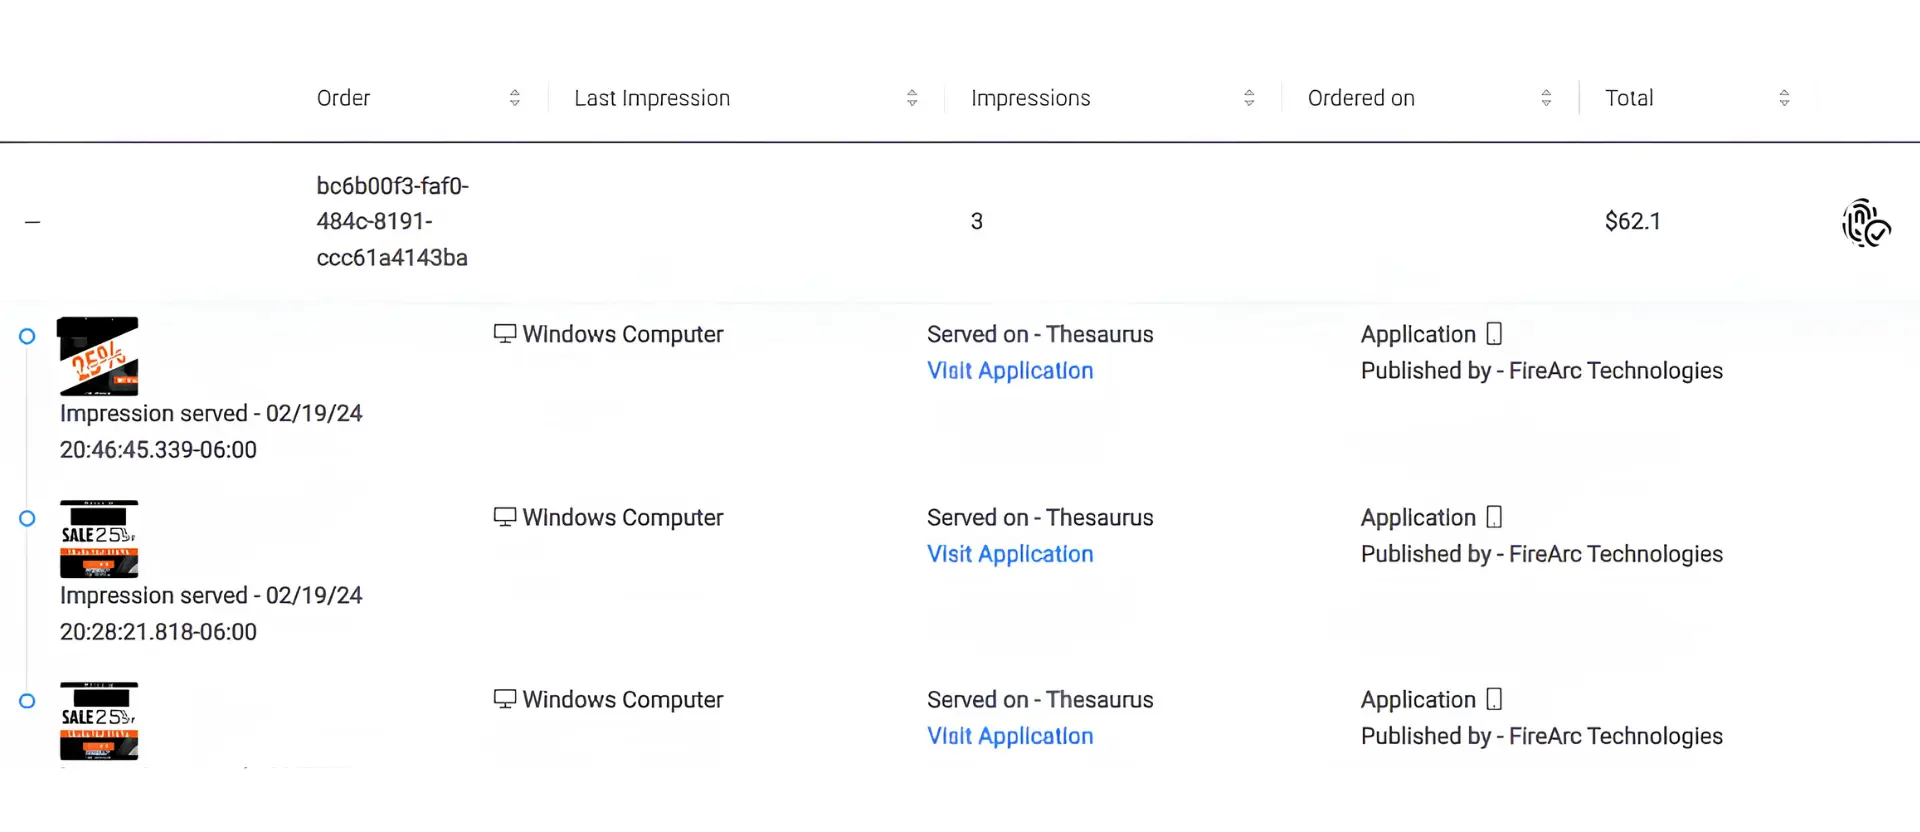
The pixel tied impressions to actual orders, so we could see which creatives, devices, and placements produced sales rather than just traffic.
What we watched weekly
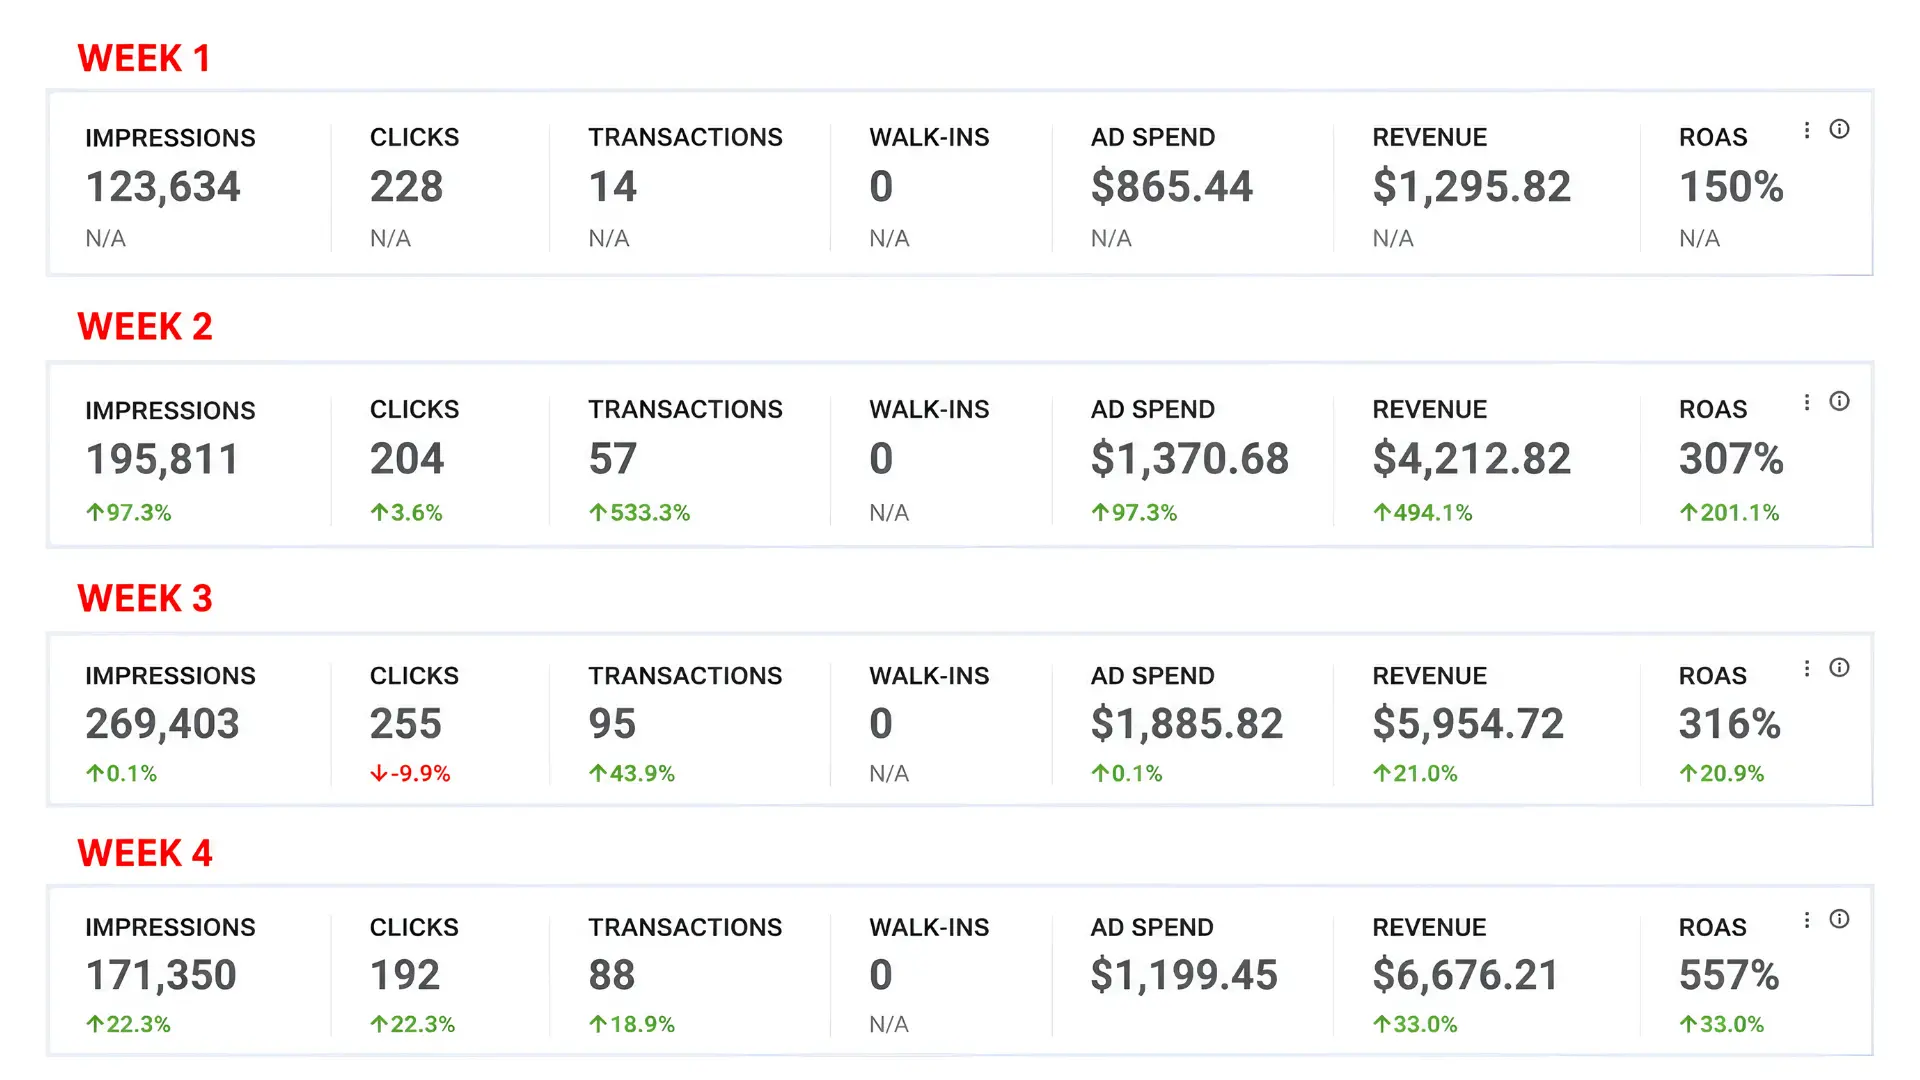
Clicks, CTR, and completed transactions. Budget moved toward whatever was converting that week.
1
What the pixel added
Which creatives, devices, and placements led to purchases, not just which ones got clicked.
2

What the product data told us to change

When we looked at which products were actually converting online, two categories were doing most of the work. We rebuilt creative around them and moved budget out of the rest.
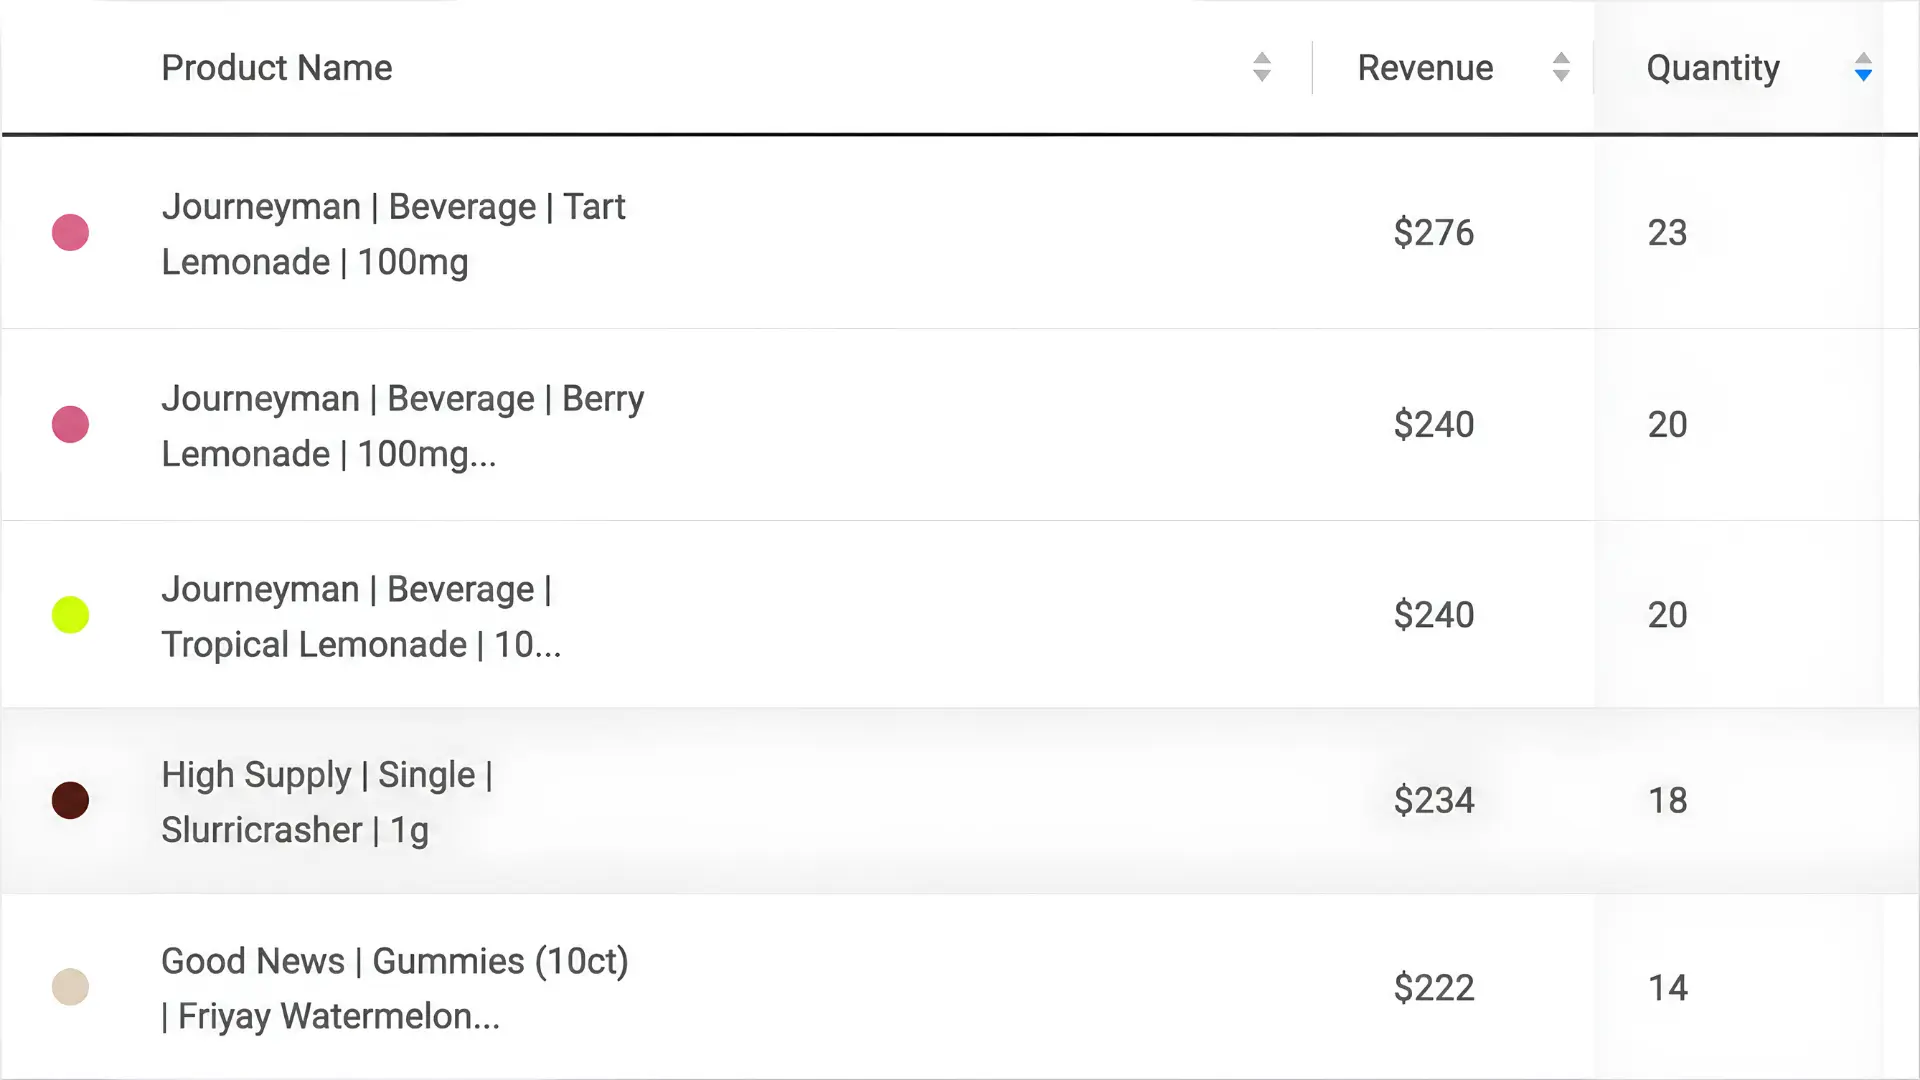
The two categories that drove most online orders.
The weekly view we used to reallocate budget.

Launch Your Campaign Today!

Let us show you how expertise in creating, monitoring, and optimizing ad campaigns can drive remarkable success.

Start the Conversation