.svg)
.svg)

Budget Drain or Revenue Gain? Your Marketing Dashboard Holds the Answer: Revenue Attribution


Would you trust a map that only shows half the route? That’s exactly what you’re doing if you’re evaluating your advertising campaigns on marketing metrics alone. It’s the same if you’re only looking at revenue metrics. Neither one tells the whole story.
Attribution reporting is the process of analyzing and assigning credit to various marketing touchpoints. Thus understanding their impact on driving marketing conversions and revenue.
Marketing attribution and revenue attribution are related, but they do different jobs. While marketing attribution provides a broad view of how channels drive actions, revenue attribution highlights financial outcomes, helping businesses make smarter, data-driven decisions.
Marketing attribution helps marketers improve their strategies by assigning credit to the touchpoints, channels, or campaigns that influence a customer’s path to purchase, using models like:
- First-touch attribution
- Last-touch attribution
- Multi-touch attribution
Revenue attribution focuses specifically on the financial impact of marketing efforts by linking campaigns or channels (like digital advertising or CTV) directly to the revenue they generate. It evaluates metrics like:
- Return on Investment (ROI)
- Customer Lifetime Value (CLV)
- Cost Per Acquisition (CPA)
For best results, we recommend you consider both revenue and marketing attribution in your strategy. However, to the frustration of most advertisers, a single multi-touch attribution marketing (MTA) platform that seamlessly visualizes the customer journey while integrating insights across SEO, Google Ads, and programmatic channels in real-time… it doesn’t exist.
Why is Modeling The Attribution Path In Your Funnel So Dang Hard?
Most MTA tools assign fractional credit (splitting credit between touchpoints) but don’t provide reliable journey visualizations (maps of the entire path to purchase). It only shows the journey on Google’s platform or Meta’s platform. But that customer who finally purchased after clicking on a Google paid listing may have been seeing Facebook posts for weeks prior.
MediaJel’s Marketing Platform consolidates your analytics into one hub, making data-driven decisions effortless.
If you want to put marketing attribution and revenue attribution to work in your data analytics strategy, you’ll need to understand how to apply these data points to make better decisions about audience targeting, promotions strategy, messaging, and more!
What is Attribution in Marketing?
The goal of marketing attribution is to understand the role of each individual marketing channel (website, email, PR, social media, etc) or campaign in the customer's decision-making process. By identifying and giving credit to the touchpoints that contribute to purchases, you can optimize your marketing strategies, allocate resources effectively, and supercharge campaign performance.
The modern customer journey is complex and multifaceted. Not only are customers interacting across many channels, but they are also accessing your content from different devices. There’s a right way and a wrong way to handle multichannel data. If you process data the wrong way, you’ll torpedo your accuracy. Data quality and integration issues inevitably lead to faulty attributions. So, accurate attribution modeling must start with meticulous attention to data accuracy and integration solutions that allow for both digital and offline attribution.
Watch the webinar “How Revenue Attribution Can Help You Maximize Your Budget” to learn more about how dispensaries can apply revenue attribution modeling.
Types of Marketing Attribution Model
Selecting an appropriate type of attribution model will be your perpetual challenge. The truth is that data can be sculpted to look however you want it to look. Rather than choosing models that show you desirable outcomes, consider which is the best fit for your campaign goals. Each one of the three options assigns credit differently. And each one has it’s pros and cons. Which one is right for your campaigns? Find out below:
First-Touch Attribution
First-touch attribution assigns all the credit for a conversion to the initial touchpoint that first introduced the customer to your brand, no matter how many other interactions occurred before the conversion. The drawback to this approach is that it ignores the persuasive impact of every other touchpoint in the customer journey. However, First-touch attribution makes sense in situations where the primary goal is to understand how customers discover your brand or where they first interact with your marketing efforts. For example, A cannabis brand launching in a new state might use first-touch attribution to identify which social media ads or influencer partnerships are generating the most initial interest.
Last-Touch Attribution
Conversely, last-touch attribution attributes all credit for a conversion to the final touchpoint before the conversion. This model is easy to grasp and implement because the goal is to understand which channels or touchpoints directly drive conversions or sales. Still, it overlooks the contributions of earlier touchpoints that may have played a crucial role in your customer's decision-making process. For example, A cannabis delivery service might use last-touch attribution to credit the push notification or retargeting ad that triggered a customer to place an order.
Multi-Touch Attribution
Multi-touch attribution marketing acknowledges and assigns value to multiple touchpoints throughout the customer journey. For example, A cannabis brand might use multi-channel attribution to measure how an Instagram post leads to a website visit, followed by a paid ad that drives the purchase. Various models fall under the multi-touch attribution marketing umbrella, such as:
- Linear attribution: Giving equal credit to all touchpoints.
- Time decay: Assigning more credit to recent touchpoints.
- Position-based attribution: Assigning credit based on the position of the touchpoint in the customer journey.
Multichannel attribution marketing can be complex to implement, first and foremost, because advertising and marketing platforms don’t play well together. Thus, MTA requires advanced tools plus expertise in analytics, audience targeting, marketing funnel strategies, and data management. But it’s okay if you aren’t an expert at all of those. MediaJel’s suite of tools aligns with your strategy, organizes your data, and shows you a clear path forward for scaling your ad campaigns.
Revenue Attribution
On the other hand, revenue attribution assigns value to different marketing channels and other business touchpoints based on their influence in generating revenue. While attribution analytics primarily focuses on marketing activities and how they impact business objectives, you can apply revenue attribution principles to various touch points across the customer journey, including sales, customer service, and production.
Benefits of Revenue Attribution Dashboards
Revenue attribution dashboards simplify data collection and analysis by offering a comprehensive view of conversion paths while providing valuable insights into how customers interact with your marketing touchpoints.
Understanding Customer Journey and Conversion Paths
Businesses that want to align their marketing strategy with the customer journey need to know which touchpoints bring in conversions. Visibility into the journey helps marketers understand the sequence of interactions and recognize patterns in customer behavior. Through customer journey visualization, attribution dashboards help businesses tailor their marketing strategies to align with customer preferences, improving overall customer experience and satisfaction. View this webinar for concrete examples of the customer journey.
Data-Driven Decision-Making
Revenue attribution dashboards provide a unified and coherent view of marketing performance by consolidating and analyzing data from various sources. The insights gained from the revenue dashboard allow marketers to optimize strategies, refine messaging, and adjust campaigns in real time based on actual performance data. This data-driven approach minimizes reliance on intuition and gut feelings, ensuring that decisions are grounded in empirical evidence.
Improving Marketing ROI
One of the primary advantages of revenue attribution dashboards is their role in improving marketing return on investment (ROI). Revenue attribution dashboards strengthen marketing strategies by providing a holistic view of customer journeys so you know which levers to pull to improve marketing ROI. MediaJel’s marketing dashboard provides insights that help identify high-performing channels, allowing marketers to invest more in strategies that deliver the best results and invest less in the ones that don’t hit it big.
Tracking with Multi-Channel Attribution Reporting
Multi-channel attribution tracks and analyzes various marketing channels and shows you how they contribute to the customer journey through your marketing funnel and overall business outcomes. By distributing credit across different touchpoints, this approach enables marketers to understand the role all channels play in driving conversions and revenue – and how they play together. Granular insight from across platforms empowers better allocation of marketing budgets, improved strategy development, and enhanced ROI measurement.
Paid Search
Paid search captures high-intent users at the middle and bottom of the funnel by driving traffic to your site and supporting other channels in conversions. For example, a cannabis dispensary could use paid search ads targeting “dispensaries near me” to attract customers who are ready to visit a retail location.
Metrics to Track:
- Click-Through Rate (CTR): Measures ad engagement.
- Cost Per Click (CPC): Evaluates spending efficiency.
- Conversion Rate: Tracks direct results from paid clicks.
- Assisted Conversions: Shows paid search support for other channels.
SEO
SEO builds top-of-funnel awareness by improving search visibility and introducing potential customers to your brand while supporting conversions through other channels. For instance, a cannabis brand might rank for "best THC beverages" to attract users researching products, which can lead to future purchases.
Metrics to Track:
- Organic Traffic: Measures visits from search engines.
- Keyword Rankings: Tracks visibility in search results.
- Bounce Rate: Reflects site engagement.
- Time on Site: Indicates how well content holds attention.
- Assisted Conversions: Shows how organic search influences conversions.
Display
Display ads drive awareness at the top of the funnel, often influencing customers to engage with other channels and eventually convert. For example, a cannabis-infused beverage brand could use display ads to showcase vibrant product visuals, calling users to search for the brand online.
Metrics to Track:
- Impressions: Measures ad visibility.
- Click-Through Rate (CTR): Tracks engagement with display ads.
- View-Through Conversions: Measures conversions influenced by ad views.
- Assisted Conversions: Shows display’s role in supporting other channels.
SMS
SMS campaigns excel at driving bottom-of-funnel conversions by delivering timely, actionable messages directly to customers. For instance, a dispensary could use SMS to send reminders about a weekend sale, encouraging immediate visits or online purchases.
Metrics to Track:
- Open Rate: Tracks how many recipients view the message.
- Click-Through Rate (CTR): Measures engagement with links.
- Conversion Rate: Shows SMS-driven sales or actions.
- Assisted Conversions: Reflects SMS’s support for other touchpoints.
Email nurtures customers through the entire funnel, keeping them engaged and driving repeat business. For example, a cannabis delivery service could send personalized emails featuring top-selling products to re-engage previous customers and encourage repeat orders.
Metrics to Track:
- Open Rate: Measures how many recipients open emails.
- Click-Through Rate (CTR): Tracks clicks within email content.
- Conversion Rate: Reflects email’s direct sales impact.
- Assisted Conversions: Shows email’s indirect contribution to conversions.
Social Media
Social media engages audiences throughout the funnel, from building awareness to fostering consideration and driving conversions. For example, a cannabis brand could use Instagram Stories to showcase behind-the-scenes cultivation, creating trust and interest that leads to purchases.
Metrics to Track:
- Impressions: Tracks how many people see your content.
- Engagement Rate: Measures likes, comments, shares, and clicks.
- Traffic Contribution: Reflects how much site traffic comes from social.
- Assisted Conversions: Shows social media’s indirect role in sales.
Connected TV (CTV)
CTV builds brand awareness at the top of the funnel, often sparking interest that converts through other channels. For example, a cannabis wellness brand could run a CTV ad showcasing the relaxing benefits of its products, leading viewers to search for more information online.
Metrics to Track:
- Impressions: Measures ad reach.
- Completion Rate: Tracks how many viewers watch the entire ad.
- Search Traffic Lift: Reflects increased searches after ad exposure.
- Assisted Conversions: Shows how CTV supports other channels.
What Makes a Robust Revenue Attribution Dashboard?
The attribution dashboard you choose impacts the accuracy and reliability of your marketing data. Please don’t pay for a marketing dashboard that gives you misguided insight. Any attribution dashboard will need these tools to do the job:
Data Sources and Integration: Revenue attribution dashboard needs to integrate with (CRM) systems, advertising platforms, web analytics tools, sales data, and every other tool in your marketing stack.
Missing data? Find out how data enrichment fills the gaps in our webinar, Unlocking Competitive Advantage Through Data Analytics and Customer Data Enrichment.
Key Metrics and KPIs: The marketing dashboard should track key metrics like conversion rates, revenue generated, customer acquisition cost (CAC), return on investment (ROI), and customer lifetime value (CLV).
Want to see more? Here are 53+ Key Performance Indicators (KPIs) For Cannabis Dispensaries.
Visualization and Reporting: Effective visualization is crucial for conveying complex attribution data, such as charts, graphs, and heatmaps, in an understandable format.
User-Friendly Interface: A user-friendly interface would include intuitive navigation, drag-and-drop functionality, and clear labeling, among other personalization features.
Your revenue attribution dashboard needs to integrate data from various sources, track relevant metrics and KPIs, and employ effective visualization and reporting techniques. When you’re vetting the options, ask yourself, “How would I tailor this marketing dashboard to align with our business goals and continuously refine it based on evolving needs and insights?”
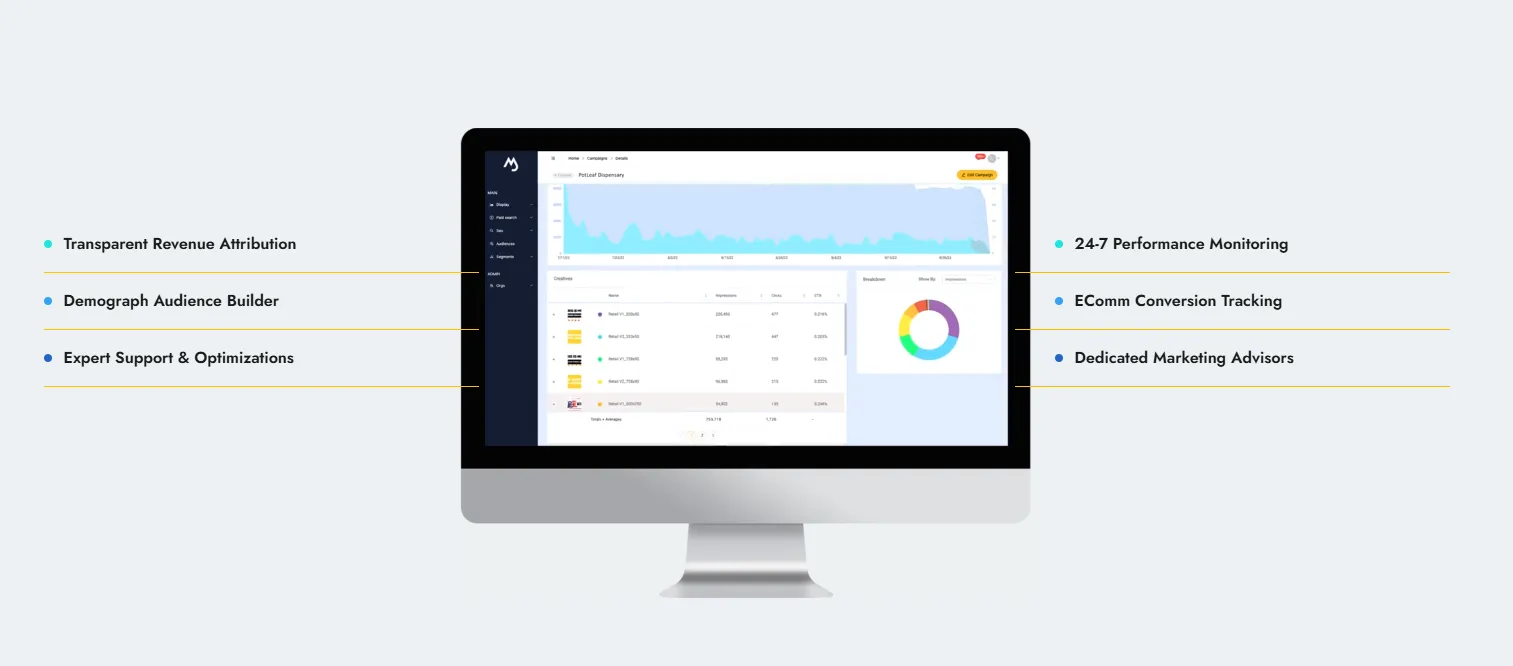
Enhance Your Marketing Attribution Strategy with Demograph
What is attribution in marketing? It’s your one-way ticket to driving profitable revenue. Demograph is an innovative revenue attribution solution that provides a comprehensive view of the customer journey, seamlessly integrates data from various sources, and includes customizable marketing dashboards with real-time reporting capabilities. Our white-label marketing dashboard empowers marketers and agencies with innovative tools to understand, analyze, and optimize the attribution strategies that drive revenue and improve ROI.
Experience the power of MediaJel's Demograph marketing dashboard firsthand! Request a demo to learn how Demograph can benefit your business. Your journey to enhanced attribution starts now!